Vantage Realty Market Update - August 2025
August Market Update
What’s Happening Nationally & Here in San Francisco
Across the country, the housing market has eased into a more balanced pace. Home prices are barely outpacing last year—up just under 2%—and actually rising slower than inflation. Inventory is starting to build as more homes hit the market, but with mortgage rates stuck in the high 6% range, a lot of buyers and sellers are still playing the waiting game. The Fed kept interest rates steady again in August, keeping an eye on both inflation and the potential impact of new tariffs.
Here in San Francisco, it’s a different vibe. Our single-family homes are moving fast—most sell in about two weeks if they’re priced well and have all the bells and whistles buyers want (yard, parking, location, natural light and great space)—yet we’re still facing an ongoing shortage of listings. Compared to last year, single-family inventory is down nearly 16% and condo inventory is down about 20%. And while condos tend to sit a little longer (averaging 44 days on the market), that segment is inching toward a more balanced market with 3.1 months of supply. Single-family homes, on the other hand, remain firmly in seller’s territory at just 1.2 months of supply.
We’re seeing these trends across neighborhoods—from the fast-moving single-family market in Noe Valley, Pacific Heights, and Bernal Heights, to the more varied pace in SOMA, Mission Bay, and South Beach’s condo scene. Low inventory is still the defining factor in competitive markets like Inner Sunset, Glen Park, and Russian Hill.
What This Means for You:
Buyers: National conditions may be easing, but San Francisco’s low inventory means you need to be ready to move quickly—especially in high-demand neighborhoods like Noe Valley, Cole Valley, and Pacific Heights.
Sellers: If you own a single-family home, conditions are still very much in your favor. For condo owners in areas like South Beach, Mission Bay, and SoMa, the market is shifting toward balance, so smart pricing and great presentation matter more than ever.
Bottom line: Nationally, the market is cooling into a steady pace, but here in San Francisco, low inventory continues to keep things competitive—especially for single-family homes in the city’s most sought-after neighborhoods. But be warned, if you price your property too high, it doesn’t matter—buyers are far too sophisticated in San Francisco to ignore market data. They are buying with their heads, not hearts.
Mortgage Rates
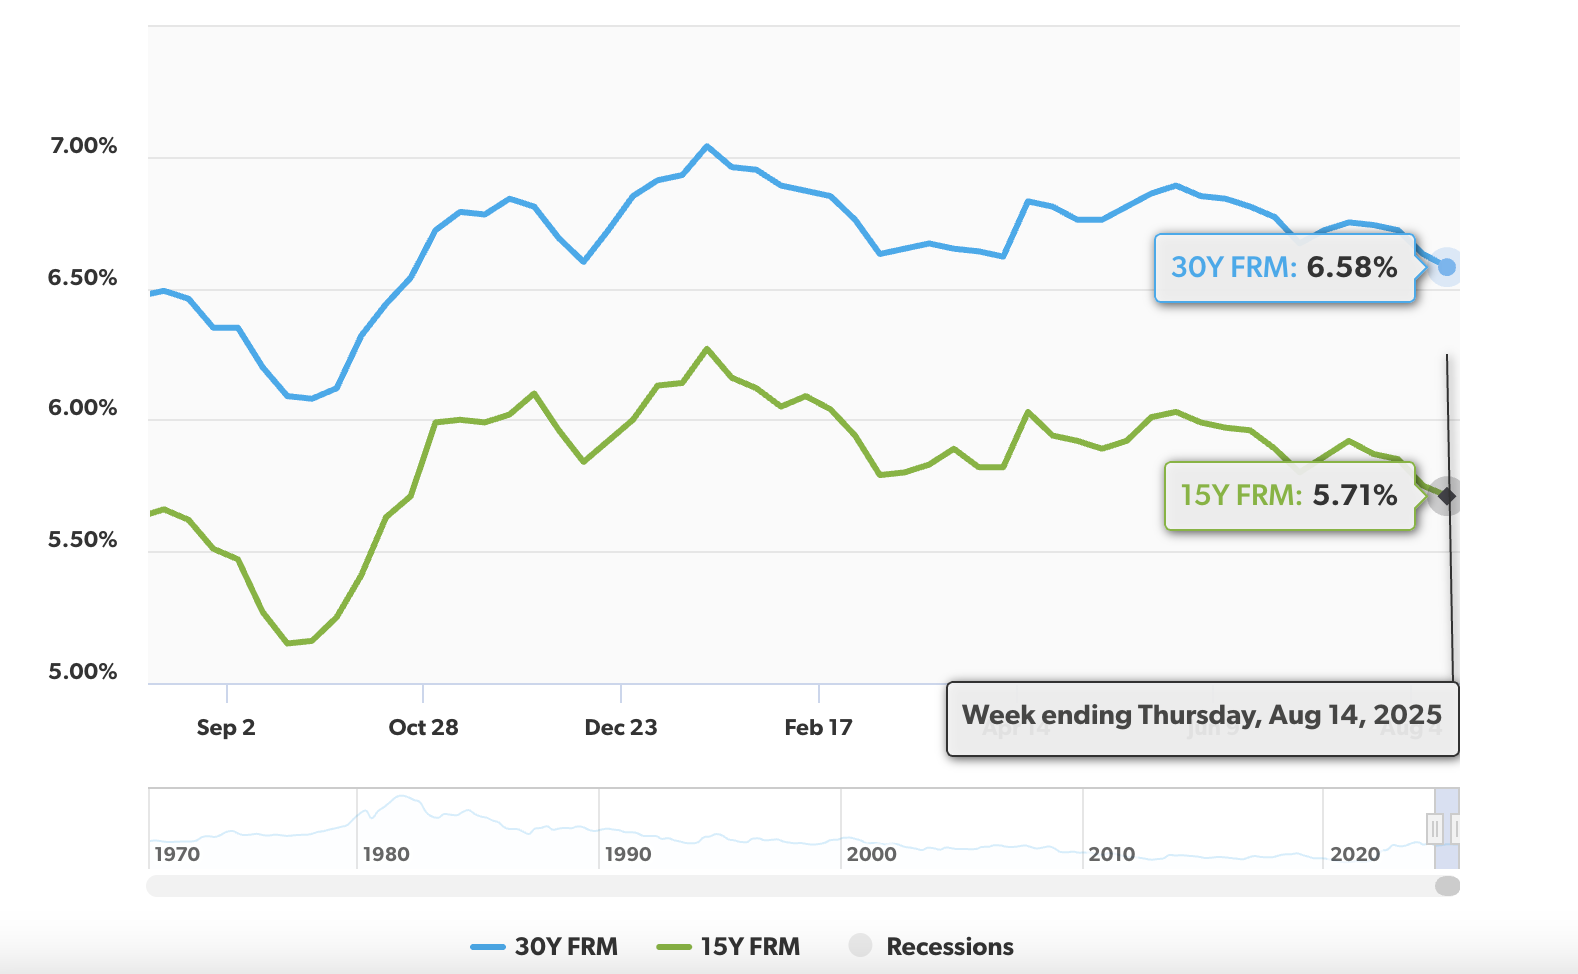
This chart shows U.S. mortgage rate trends through August 14. The 30-year fixed-rate mortgage (30Y FRM) sits at 6.58%, while the 15-year fixed-rate mortgage (15Y FRM) is at 5.71%. Both rates have remained relatively stable over the past several months, following a period of volatility earlier in the year. The high-6% range for 30-year loans and the mid-5% range for 15-year loans continue to keep borrowing costs elevated compared to the historic lows of just a few years ago, which is contributing to slower home sales activity in many markets. While small week-to-week fluctuations have occurred, there’s been no significant downward movement—leaving many potential buyers and sellers waiting for clearer signals from the Federal Reserve on future rate cuts. (FreddieMac)
Mortgage Rate Projections and Hopes
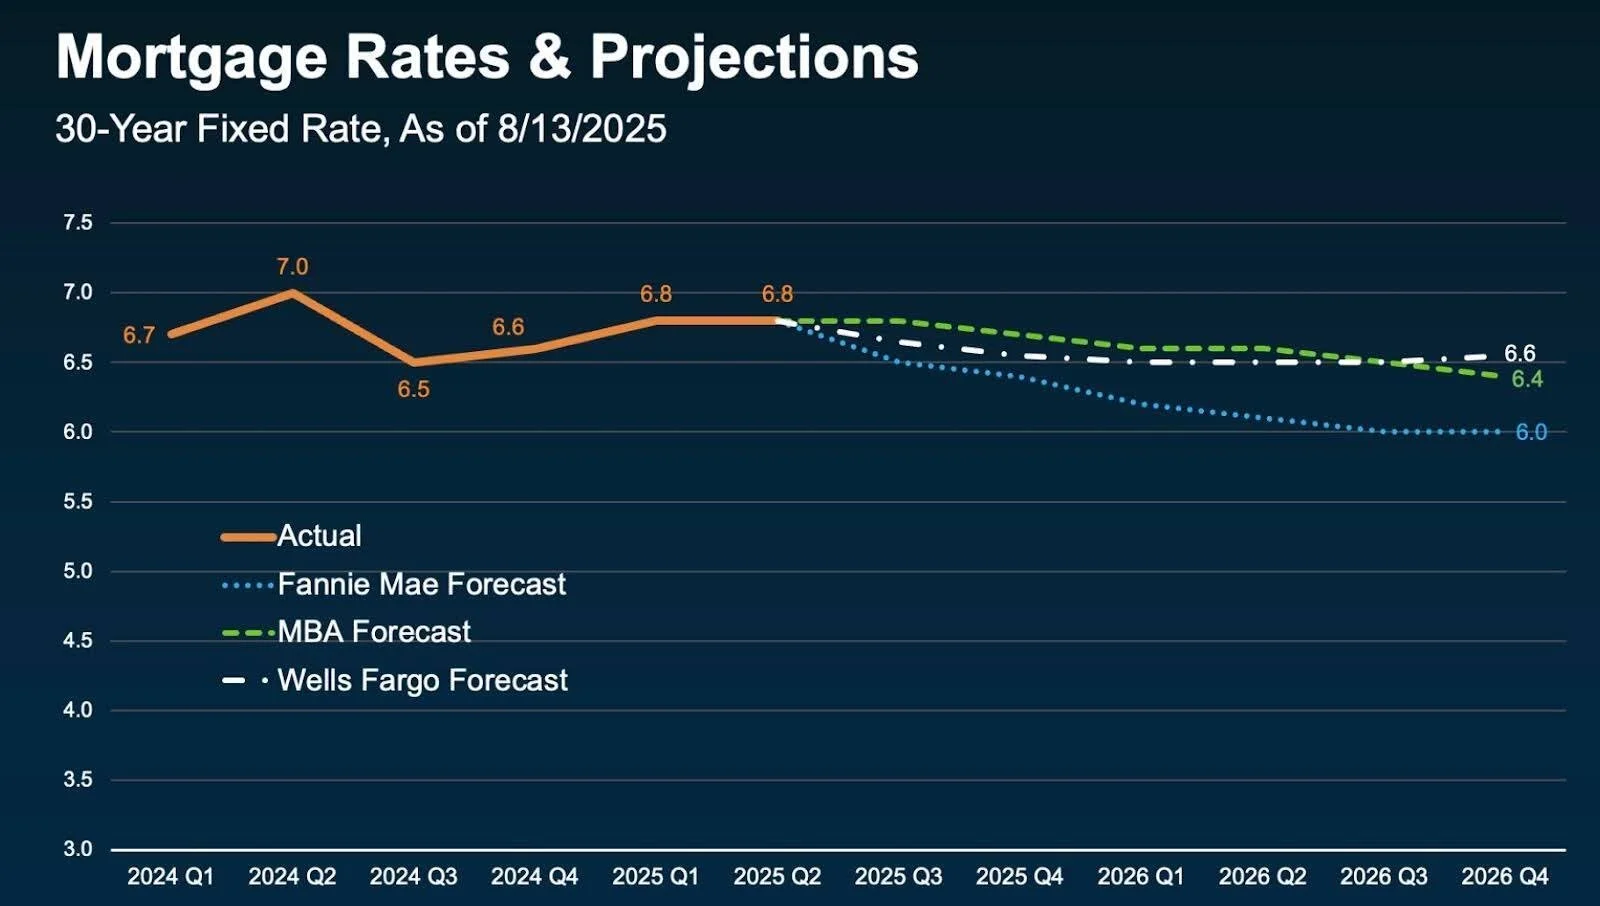
Everyone’s watching for rates to dip to 6%—the magic number that the National Association of Realtors (NAR) says could bring 5.5 million more buyers into the market, with 550,000 people likely to buy in the next 12-18 months. Most forecasts keep rates in the mid-to-low sixes through next year, though a recent dip to 6.55% sparked hope. Big drops aren’t expected soon, but small shifts are possible. Waiting could mean more competition and less negotiating power, so if buying now works for you, it may be the smarter move. (Keeping Current Matters and NAR)
Employment Numbers
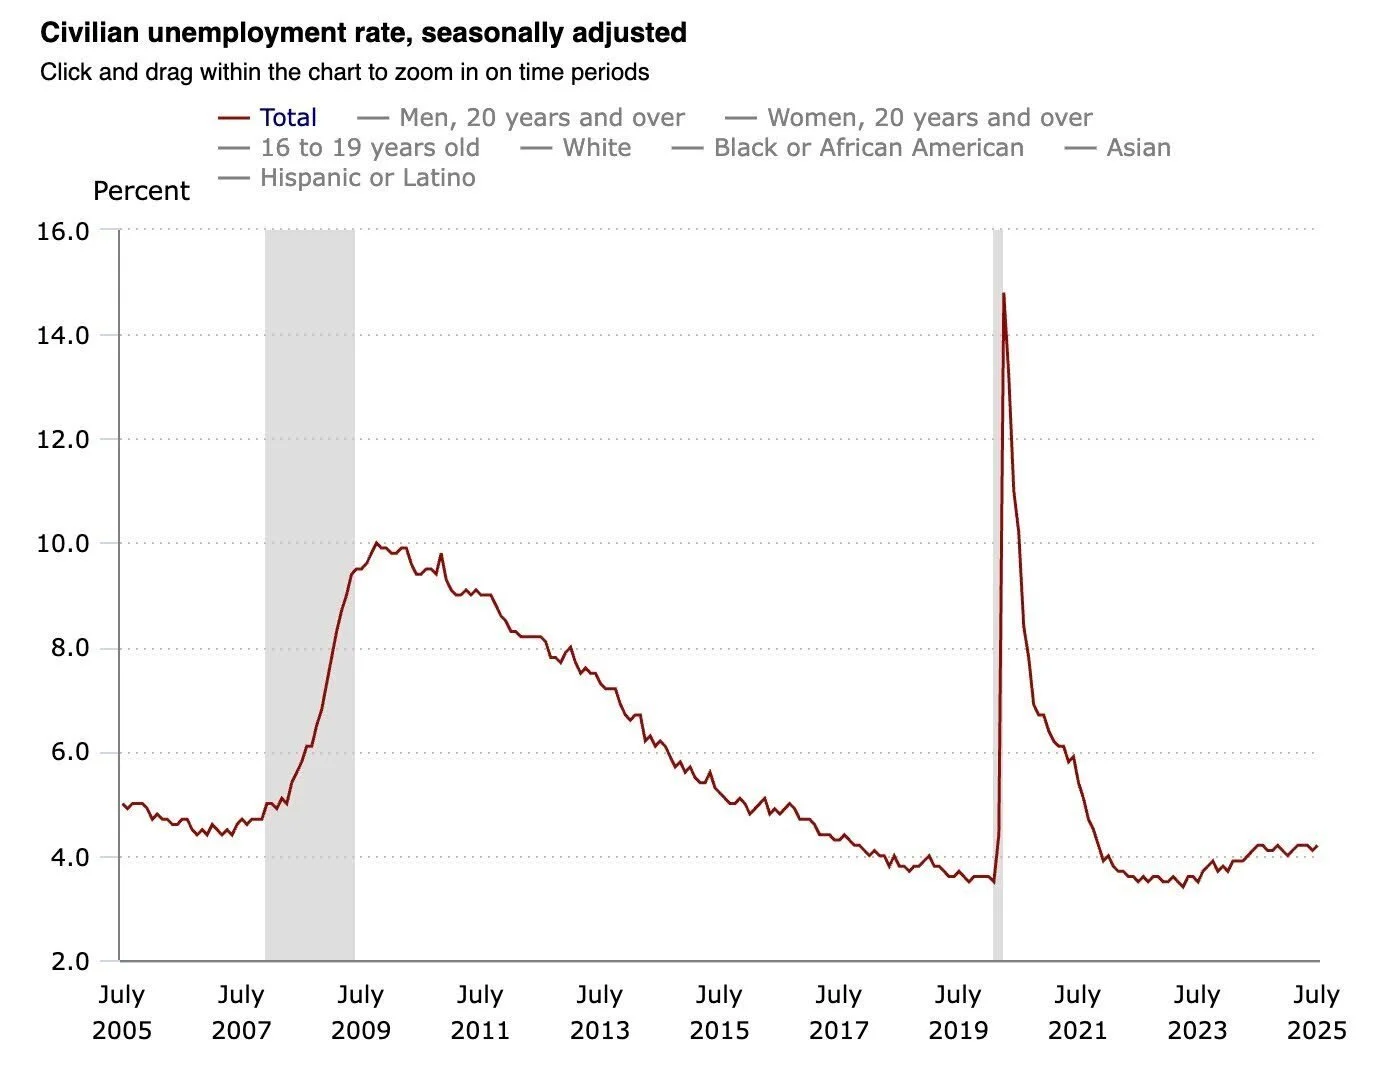
This chart tracks the seasonally adjusted U.S. unemployment rate from July of 2005 to 2025, highlighting sharp spikes during the Great Recession and the COVID-19 pandemic, when unemployment briefly exceeded 14%. Since then, the rate has eased and held near 4%, landing at 4.2% in July 2025. (Bureau of Labor Statistics)
Consumer Price Index
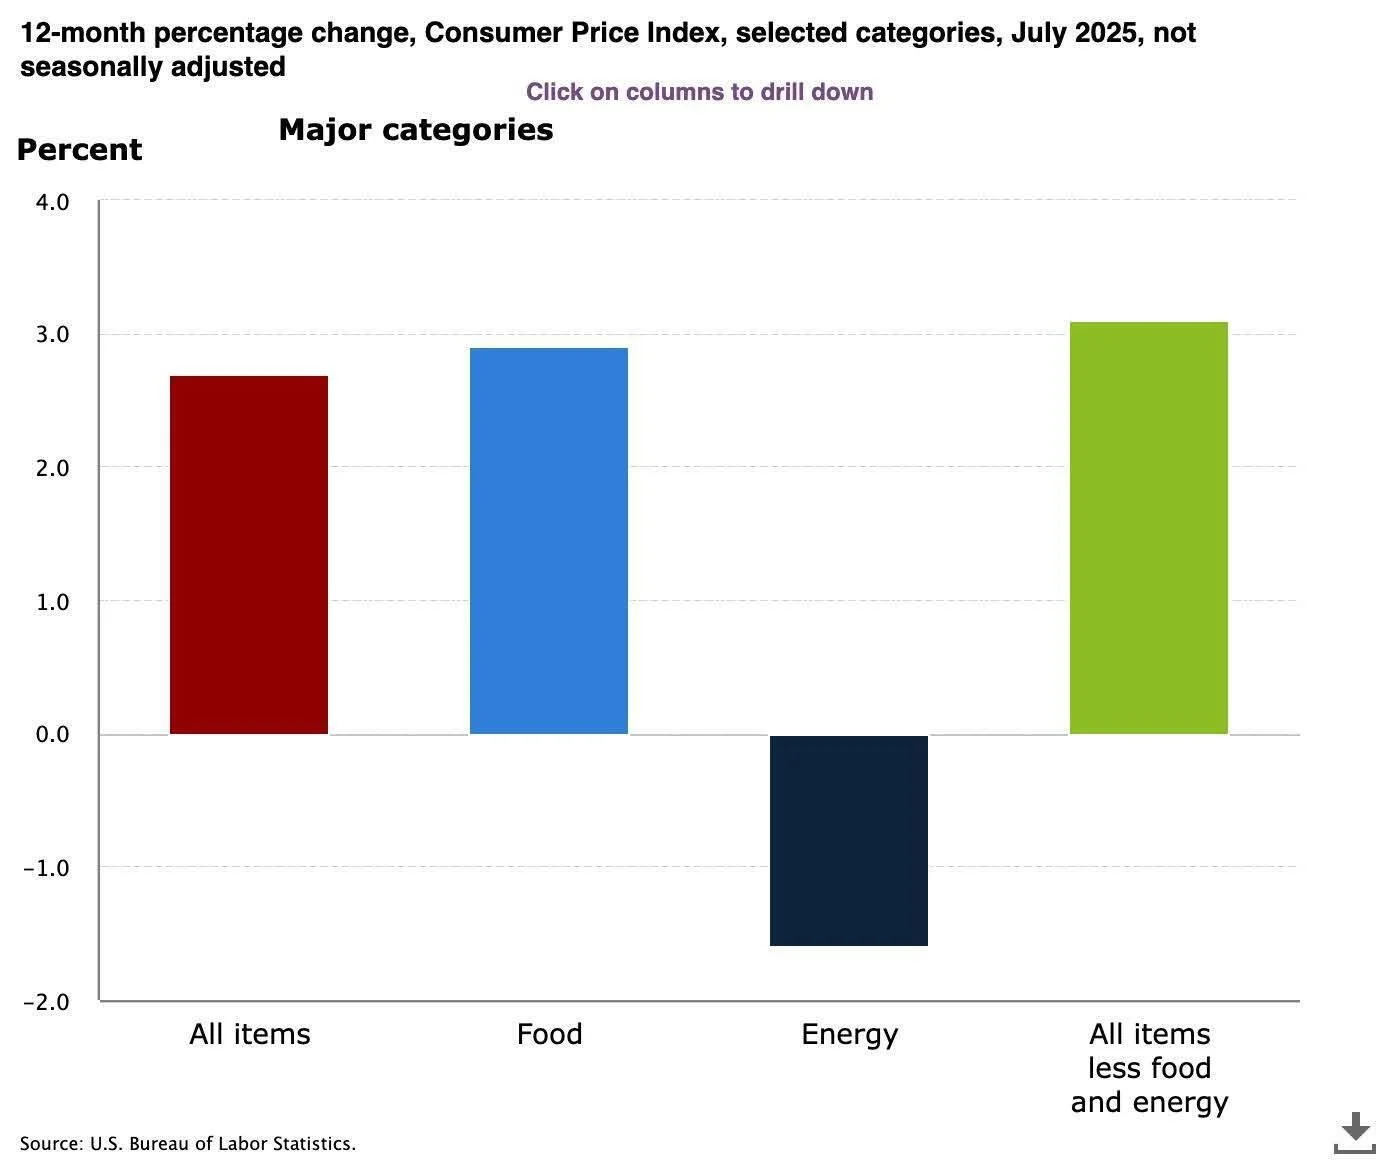
The all-items index is up 2.7% year-over-year. Food prices rose 2.9%, while energy costs fell 1.6% over the same period. Core inflation (all items less food and energy) increased 3.1%, driven by higher shelter, medical care, and travel costs. Energy’s decline—led by a 2.2% drop in gasoline—helped offset some of the overall price gains. (Bureau of Labor Statistics)
Seller Concessions
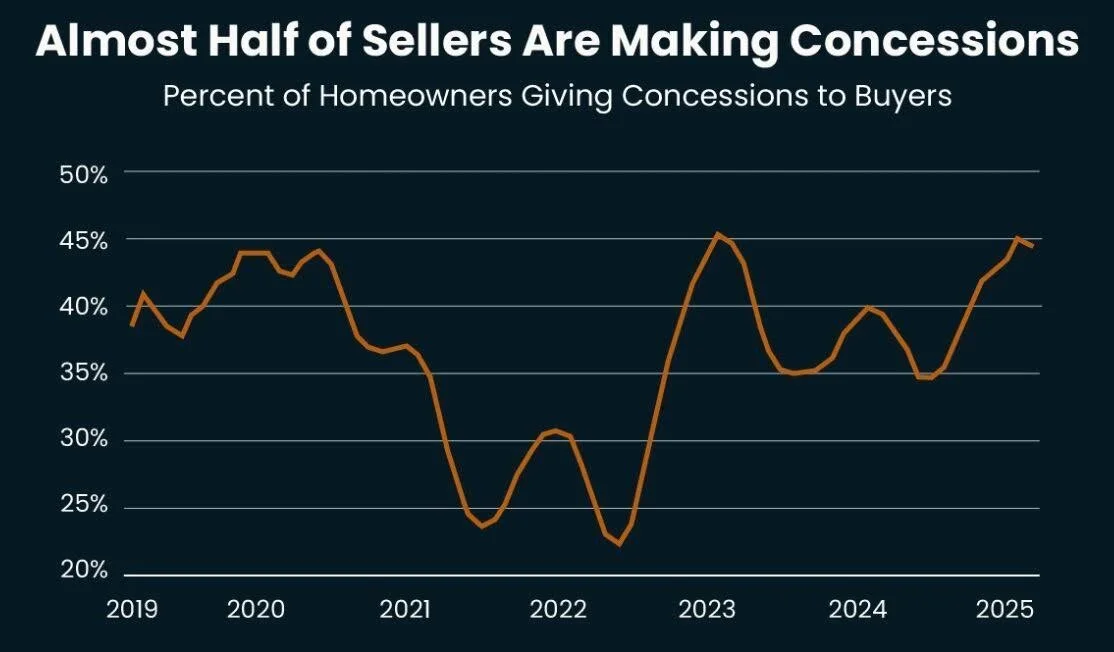
Nearly half of all sellers in the U.S. are offering concessions to buyers to help close the gap to sell their homes to cash-strapped buyers burdened with higher interest rates. Concessions can come in the form of commissions, reduced sale prices, making repairs and covering closing costs. (KCM)
Market Trends: A Regional Divide
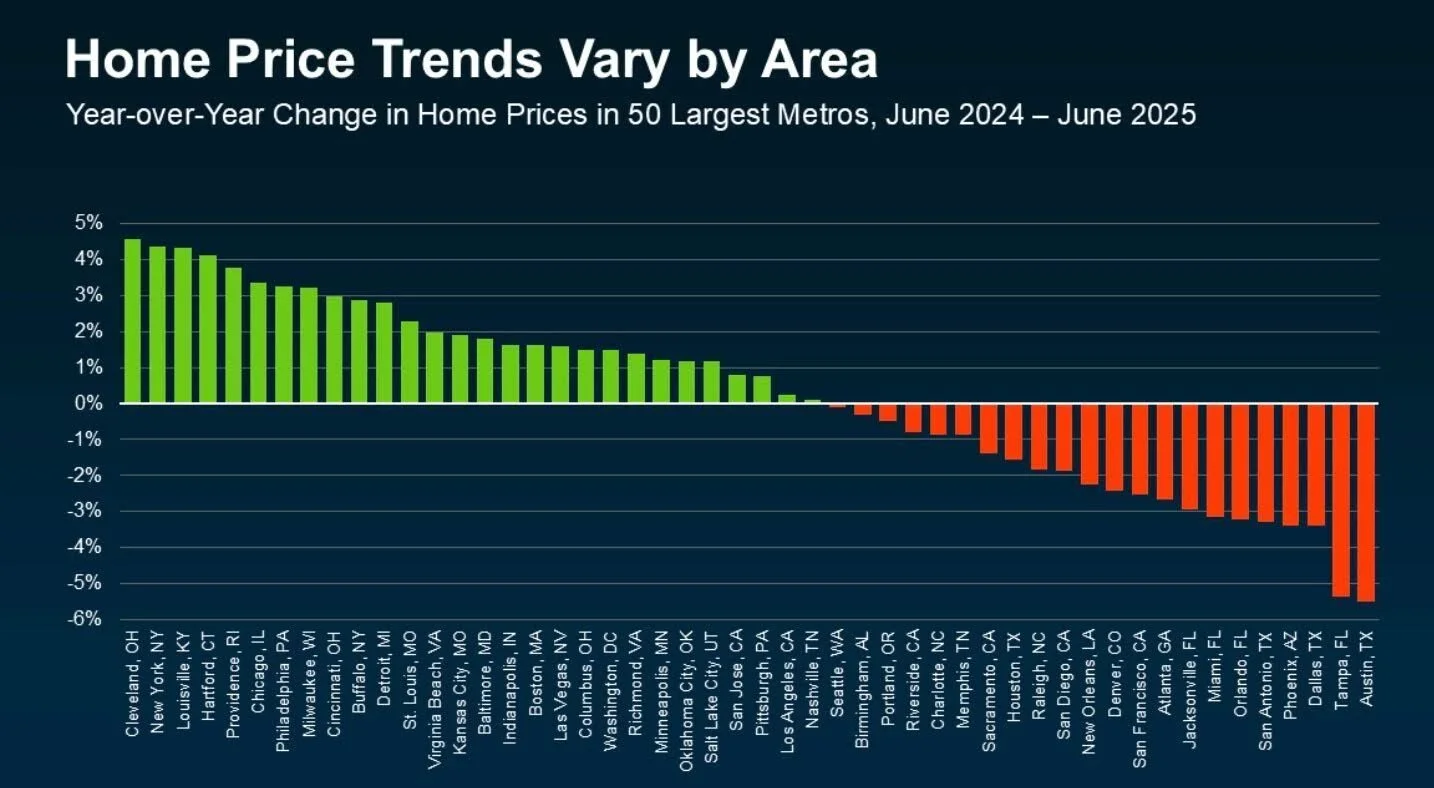
The Northeast and Midwest remain seller’s markets, with more buyers than homes for sale—driving faster sales and rising prices. In contrast, the South and West are tilting toward buyer’s markets, where higher inventory and less competition mean more choices and negotiating power. This marks a major shift from just a few years ago, when sellers dominated nationwide. Now, local conditions matter more than ever—even between neighboring communities. (KCM)
New Listings in the United States
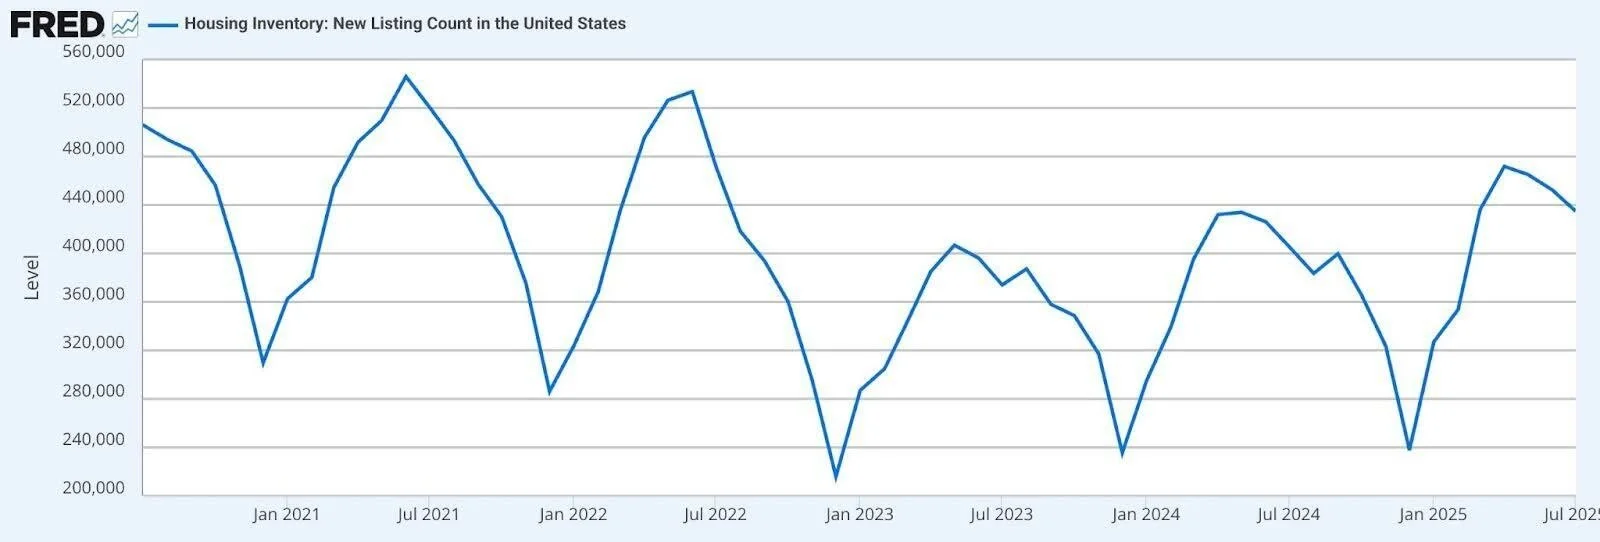
U.S. new home listings continue to follow a seasonal pattern, peaking in mid-year and dipping sharply each winter. While 2025 levels have rebounded from early-year lows, they remain well below the highs seen in 2021, signaling a still-tight housing supply. However, as of July 2025, there were approximately 435,000 new listings, an improvement over July 2024’s 404,000 new listings and July 2023’s 374,000 new listings. (Federal Reserve Bank of St. Louis)
The San Francisco Numbers
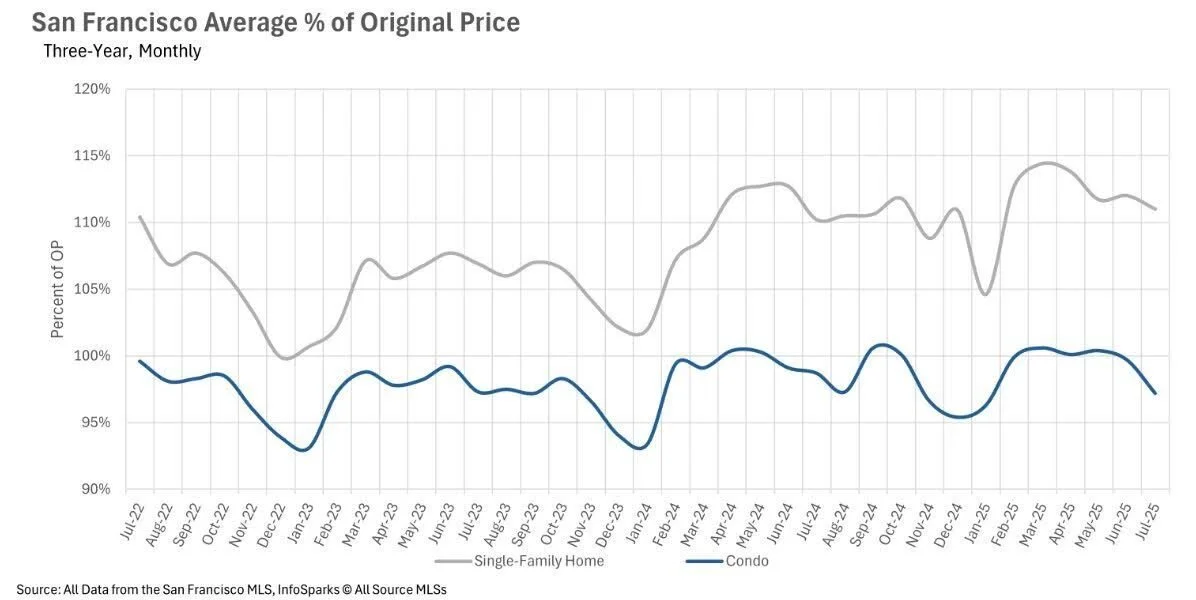
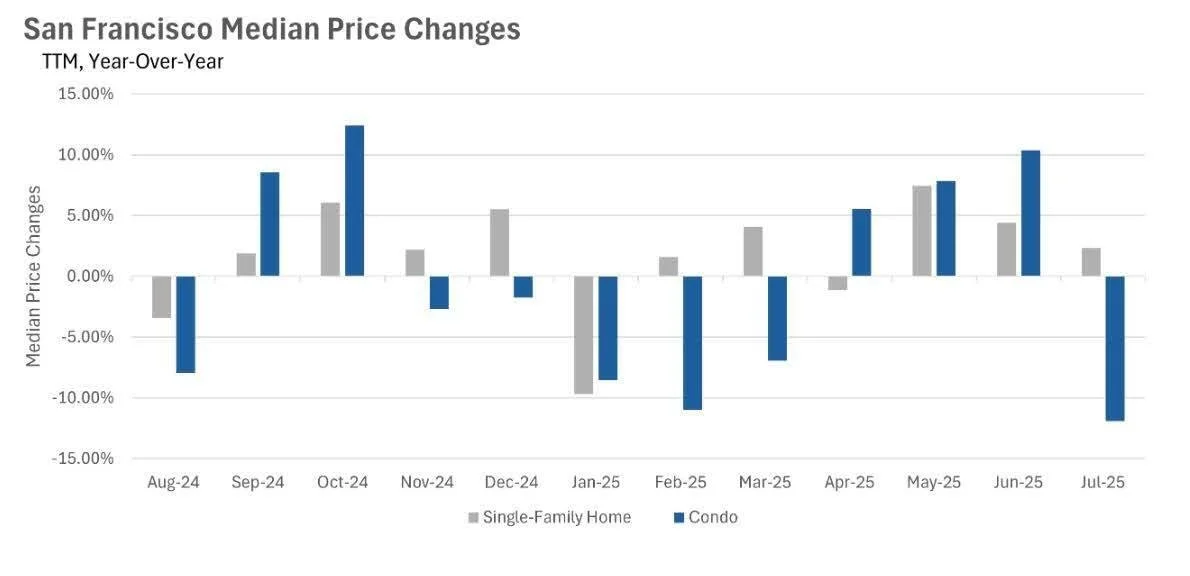
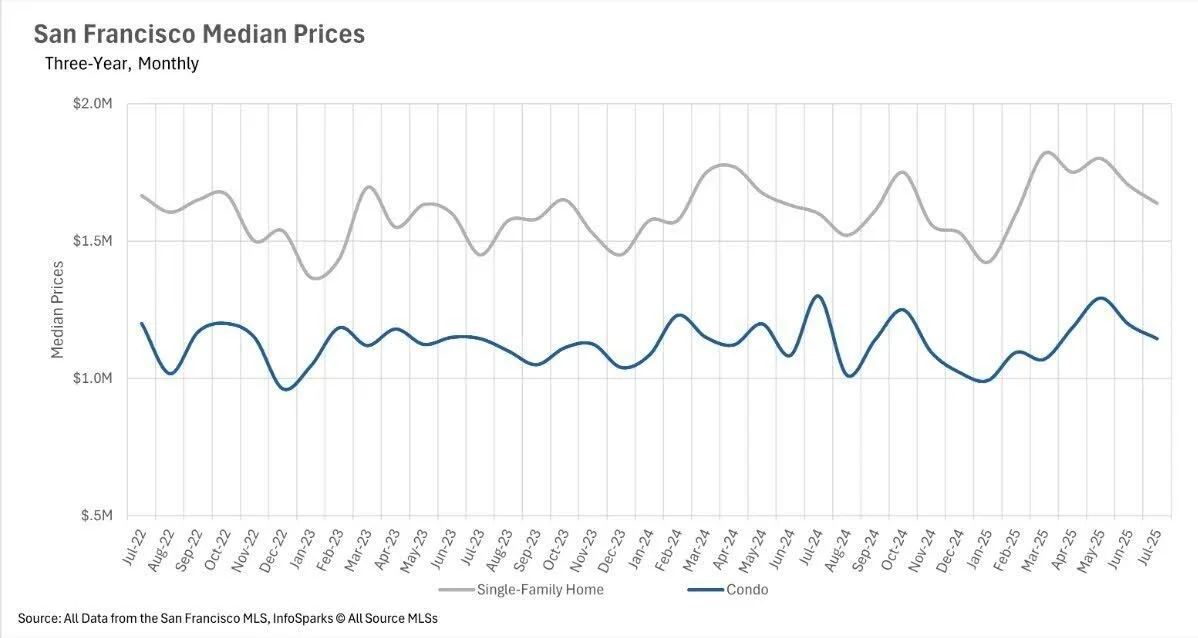
In San Francisco, homes are still selling within their typical historical timeframes. Inventory remains exceptionally tight, but condos continue to linger on the market longer than other property types. Home prices remain in a steady “business as usual” range. While condo median sale prices dropped 11.92% year-over-year—largely due to volatility in this segment—single-family homes saw a modest 2.34% increase.
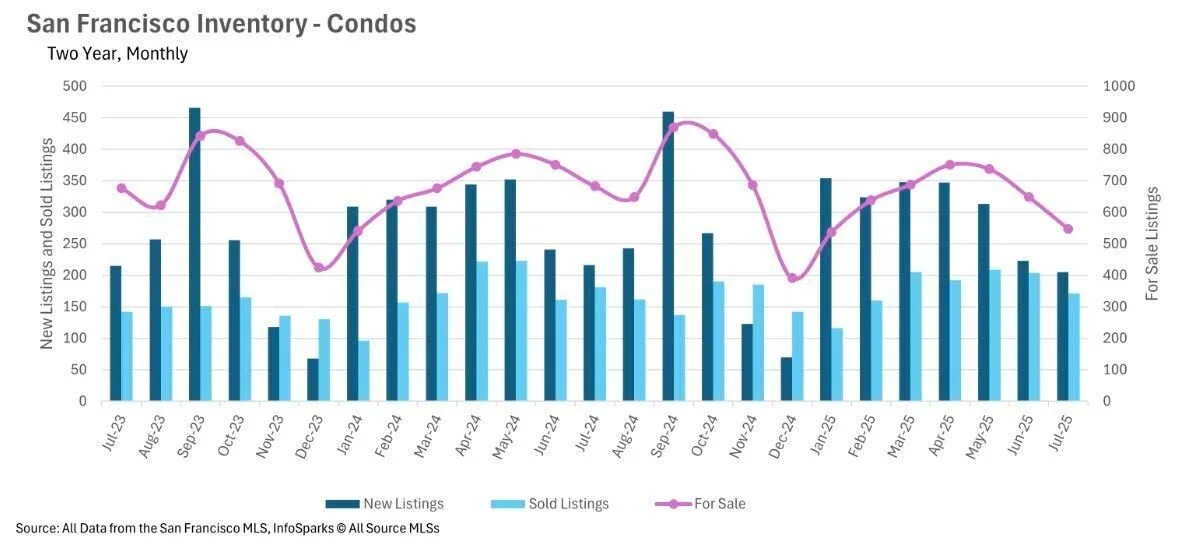
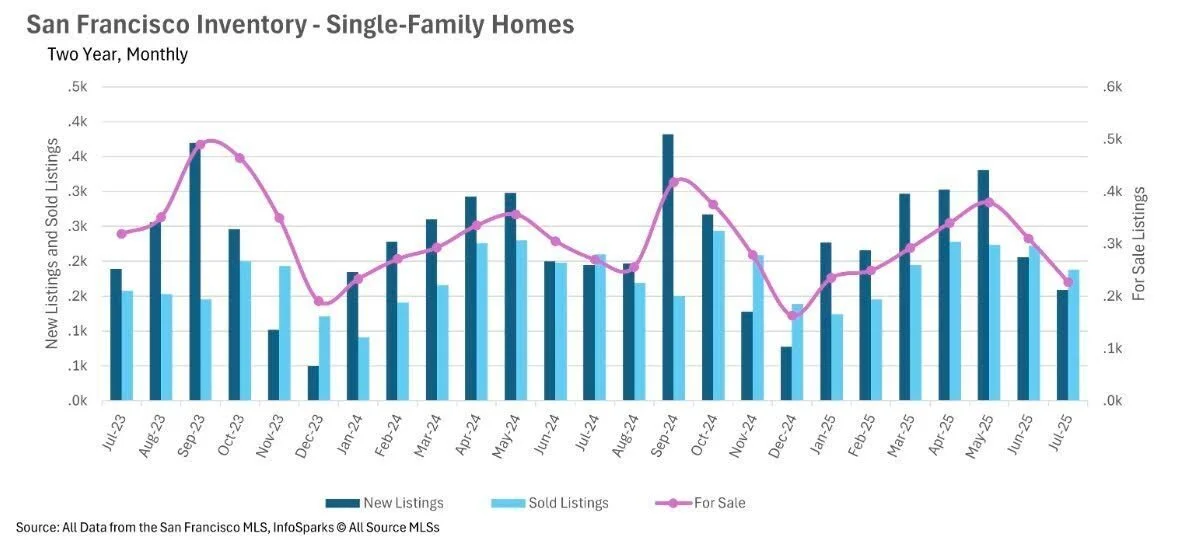
Unlike much of the Bay Area where listings are building up, San Francisco continues to face a severe lack of inventory. In July, single-family inventory fell 15.93% year-over-year, while condos dropped 19.91%. The slowdown in new listings is a big factor—down 18.46% for single-family homes and 5.09% for condos compared to last year.
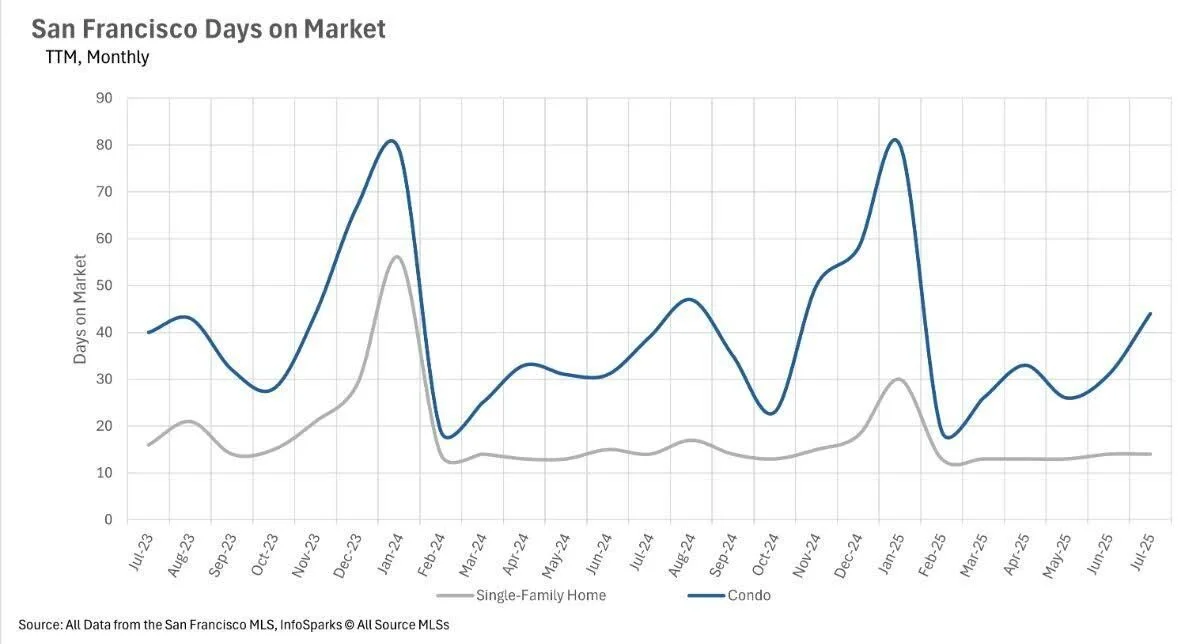
Well-priced, turn-key single-family homes are flying off the shelf—averaging just 14 days on market in July. Condos, however, are taking much longer to move, averaging 44 days, a 12.82% increase from last year. While this gap is notable, it’s consistent with the city’s historical trend of condos selling more slowly than single-family homes.
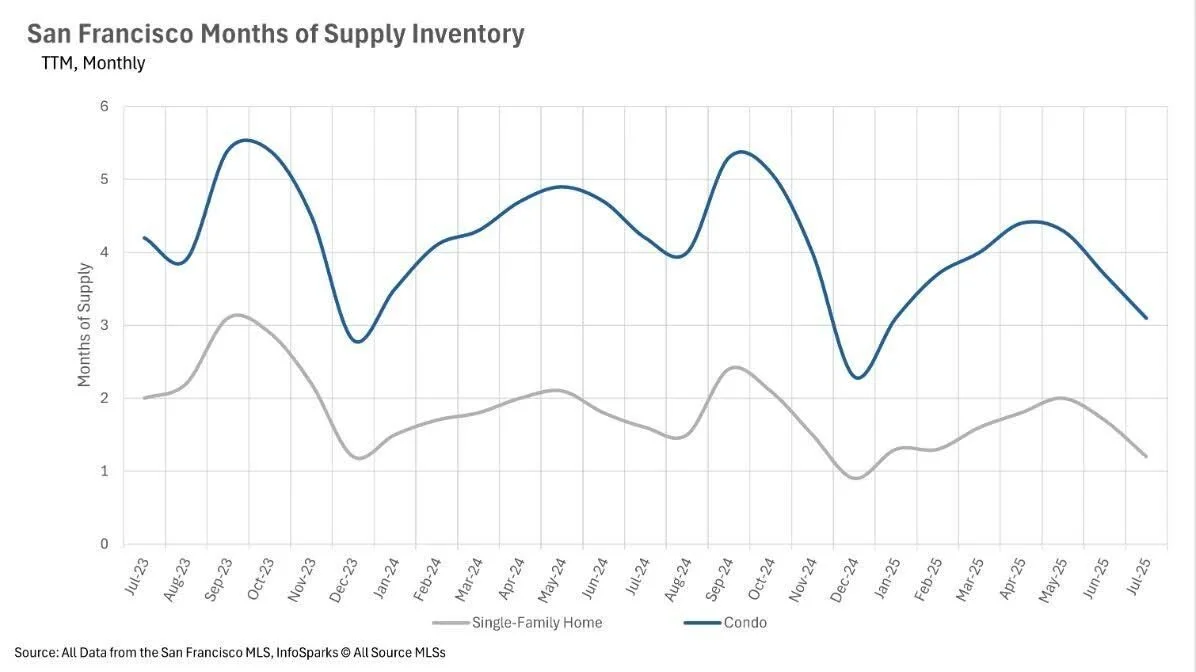
The Months of Supply Inventory (MSI) helps determine market conditions: around 3 months is considered balanced, less favors sellers, and more favors buyers. San Francisco’s condo market now sits at 3.1 months of supply, edging closer to balance after years as a buyer’s market. The single-family market, meanwhile, remains firmly in seller’s territory with just 1.2 months of supply.