
The Market Isn’t Budging
Summer has arrived, but the story of San Francisco real estate remains remarkably consistent: demand continues to outpace supply. While mortgage rates and economic headlines dominate the national conversation, the local market is being driven by a different set of forces. A resurgence in Bay Area wealth creation, particularly within the technology and AI sectors, combined with a persistent shortage of available homes, continues to fuel competition across many neighborhoods.
That demand is no longer confined to the for-sale market. Rental inventory remains exceptionally tight, pushing rents higher and creating challenges for many would-be tenants. At our open houses, we're meeting more renters than ever before, many of whom are discovering that the gap between renting and owning isn't as wide as they expected. As a result, we've been spending considerable time helping clients compare the true cost of renting versus buying, often finding that homeownership is more attainable than they initially believed.
Of course, broader economic factors still matter. A new Federal Reserve Chair took office in May, introducing fresh questions about the future path of interest rates. Meanwhile, ongoing geopolitical tensions and uncertainty in global markets have the potential to influence inflation, consumer confidence, and borrowing costs. While these developments bear watching, they have yet to alter the fundamental imbalance between buyers and sellers here in San Francisco.
For now, the scales remain tipped in favor of sellers. Until inventory rises in a meaningful way, buyers will continue to compete for a limited number of homes, supporting strong prices and keeping market conditions firmly in seller territory.
The Data
Mortgage Rate Movement
Mortgage rates remain below where they stood a year ago, despite recent volatility. As of June 15, the average 30-year fixed-rate mortgage was 6.47%, down from 6.81% one year ago, while the 15-year fixed rate stood at 5.81%, compared to 5.96% last June. While rates remain elevated by historical standards, today's buyers are benefiting from modest improvements in borrowing costs compared to last year's market. (Freddie Mac)

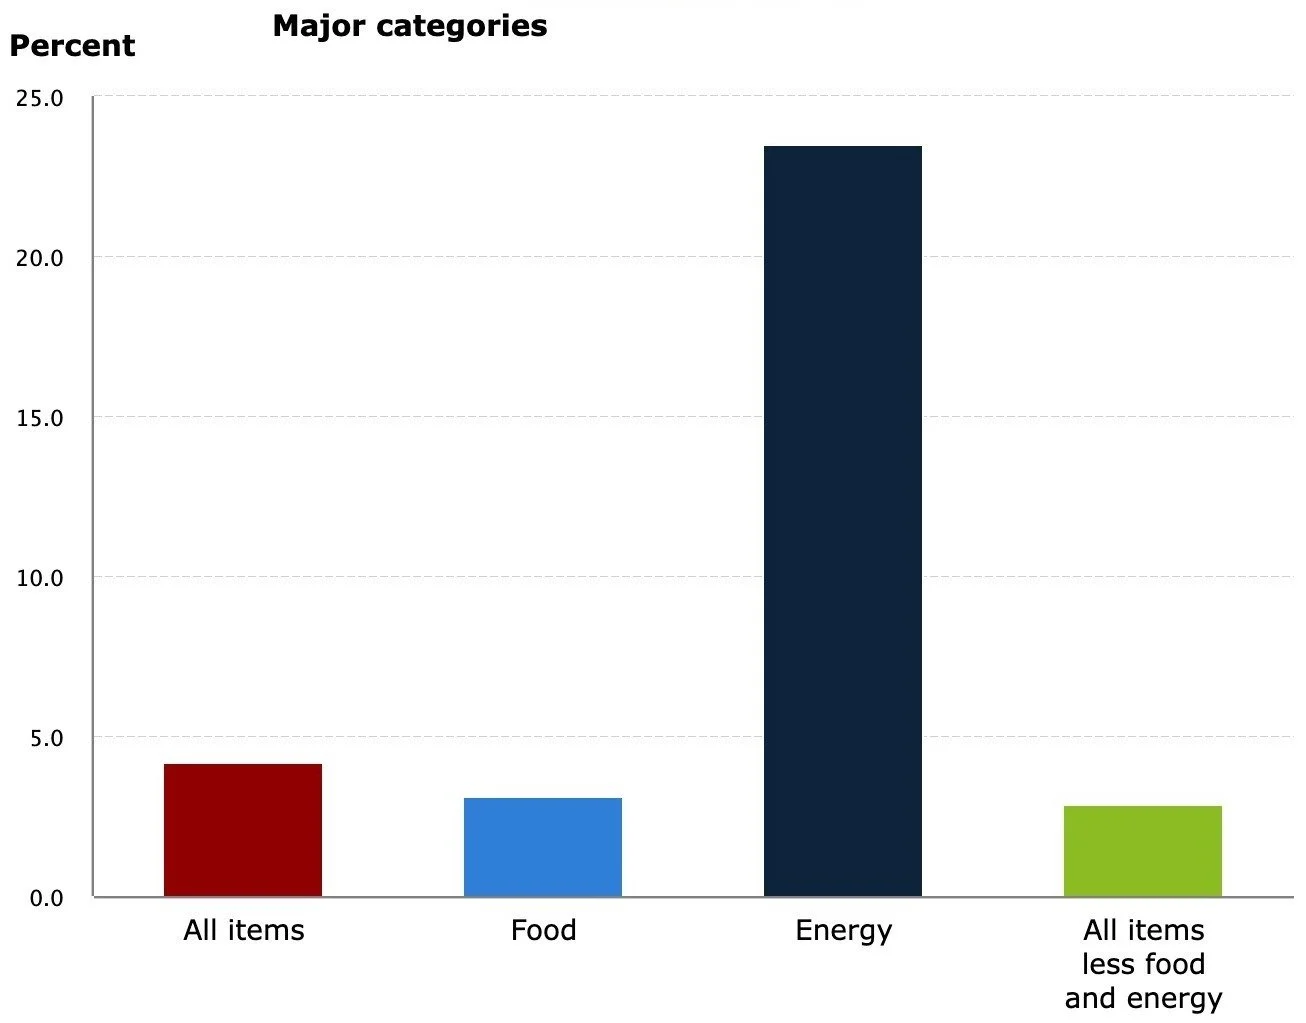
Consumer Price Index
The cost of consumer goods and services continued to rise in May. Overall prices were up 4.2% compared to a year ago, while prices excluding food and energy increased 2.9% over the same period. The Consumer Price Index (CPI) is a measure of the average change over time in the prices paid by urban consumers for a market basket of consumer goods and services. (Bureau of Labor and Statistics)
National Concerns
Affordability pressures continue to weigh on buyer demand. Higher mortgage rates have made homeownership less attainable for many first-time buyers, leading some properties to spend more time on the market and prompting renters to delay purchasing decisions. The below chart is a revision of the national housing forecast for 2026, expecting slower sales but steady prices. (Keeping Current Matters)

National Home Price Growth is Moderating
National home price appreciation continues to moderate. After peaking at more than 20% year-over-year in 2022, annual price growth has steadily slowed to just above 1%. While buyer demand remains selective in many markets, limited inventory continues to support home values. Many homeowners are choosing to stay put rather than give up their existing low-rate mortgages, keeping the supply of homes for sale constrained and helping prevent more significant price declines. (Case-Shiller)

Real Estate is Local
Real estate remains a local market. While 17 states have now surpassed their pre-pandemic inventory levels, much of the Northeast and Midwest continue to face limited housing supply. The result? Markets with constrained inventory are generally seeing continued price appreciation, while areas with more abundant inventory are experiencing slower growth or modest price corrections. The below graphic shows the inventory shift between May 2019 and May 2026, with 17 states back above 2019 levels. (Realtor.com)

Foreclosure Activity in the US
Foreclosure activity has increased gradually as the housing market continues to normalize. Although filings have risen from the exceptionally low levels recorded during and immediately after the pandemic, today's foreclosure rates remain well below long-term historical averages. The chart below shows foreclosure filings across the United States. (ATTOM)

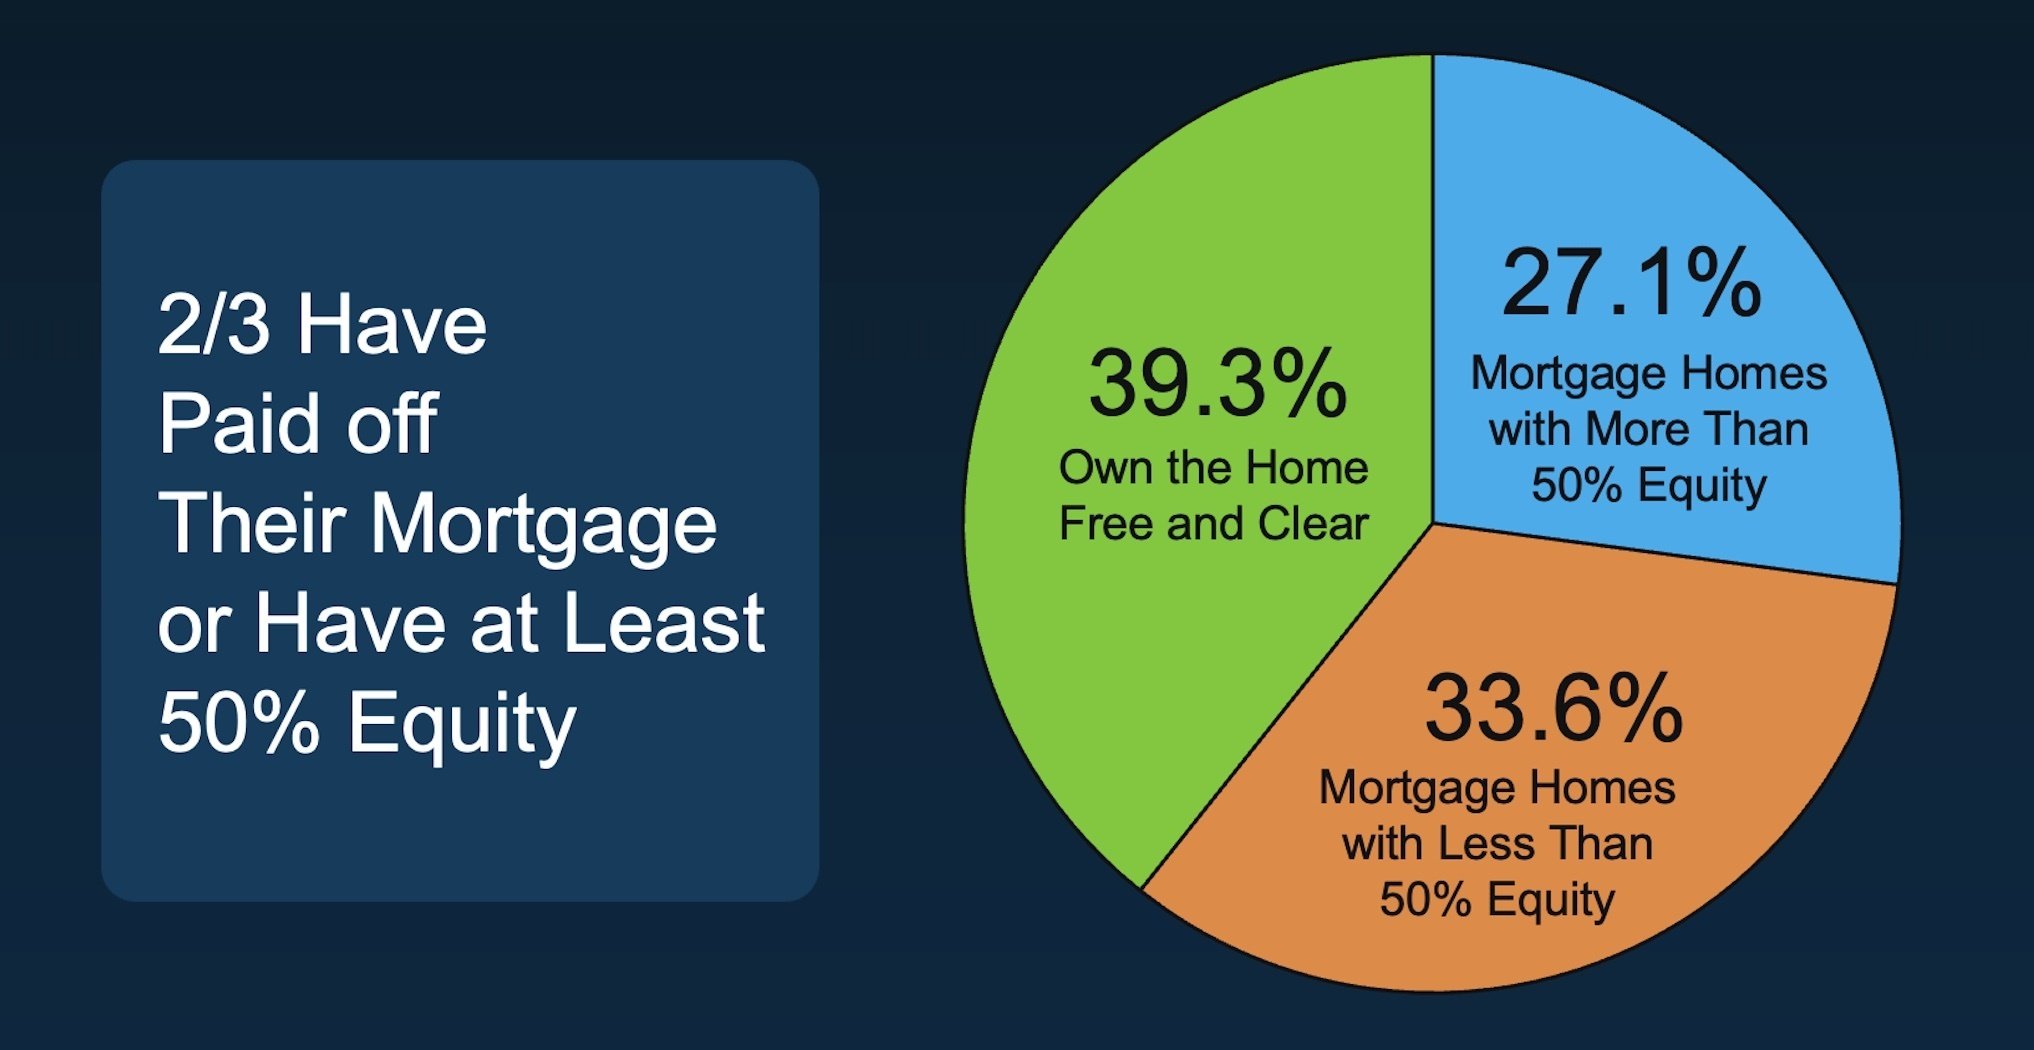
Americans Are Sitting on Tremendous Equity
Record levels of homeowner equity continue to support housing market stability. With nearly two-thirds of homeowners owning their home outright or holding at least 50% equity, most sellers are well positioned and far less vulnerable to market fluctuations than during previous housing cycles. (ATTOM)
The Resilient San Francisco Market
While buyers across much of the country remain cautious, San Francisco continues to tell a very different story. Well-priced, well-located, and thoughtfully presented homes are attracting strong demand, selling quickly, and often for well above asking price. The market metrics below highlight just how resilient and competitive our local market remains.
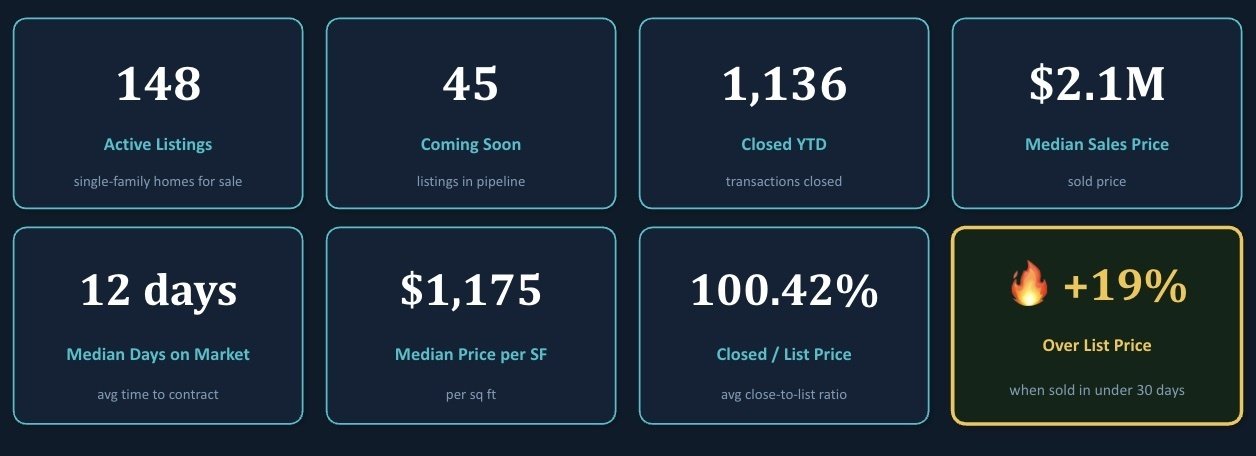
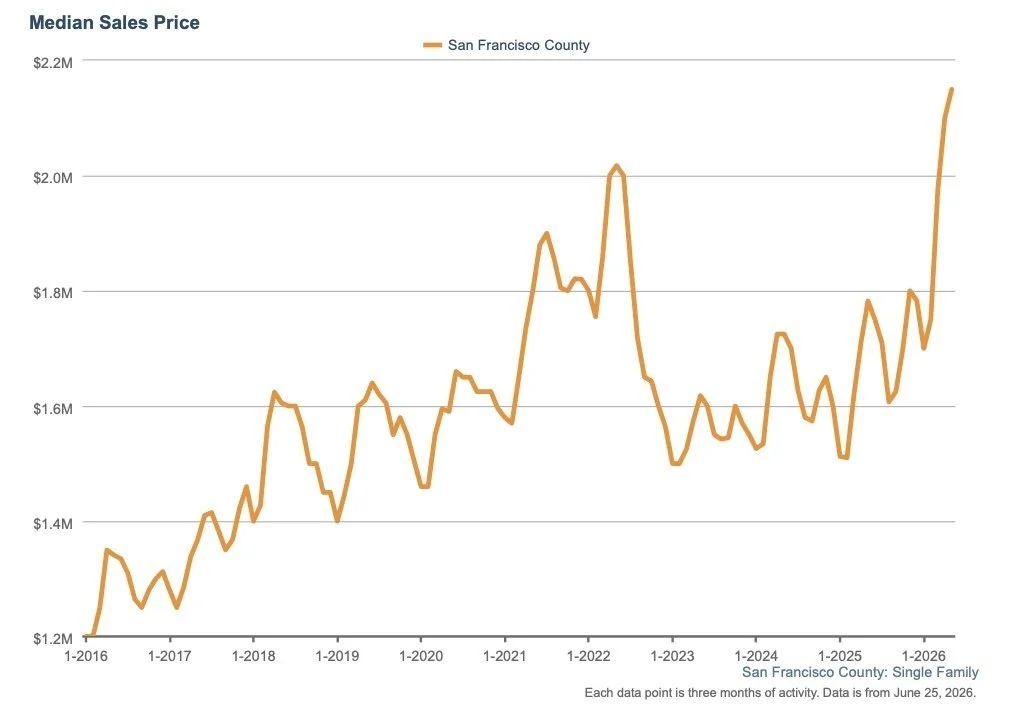
San Francisco Home Prices Hit A Record High
San Francisco's single-family home market continues to defy expectations. The median sales price climbed to a record $2.2 million in May fueled by exceptionally tight inventory, just 12 median days on market and homes closing at an average of 100.42% of list price. For properties that attract buyers quickly (under 30 days), the average premium jumps to an impressive 19% over asking.
The chart below illustrates just how dramatic this latest surge has been. After years of market fluctuations, median prices have now reached their highest level on record, underscoring the strength of buyer demand and the continued scarcity of available homes. For well-prepared sellers, today's market remains one of the strongest we've seen in years. (InfoSparks)
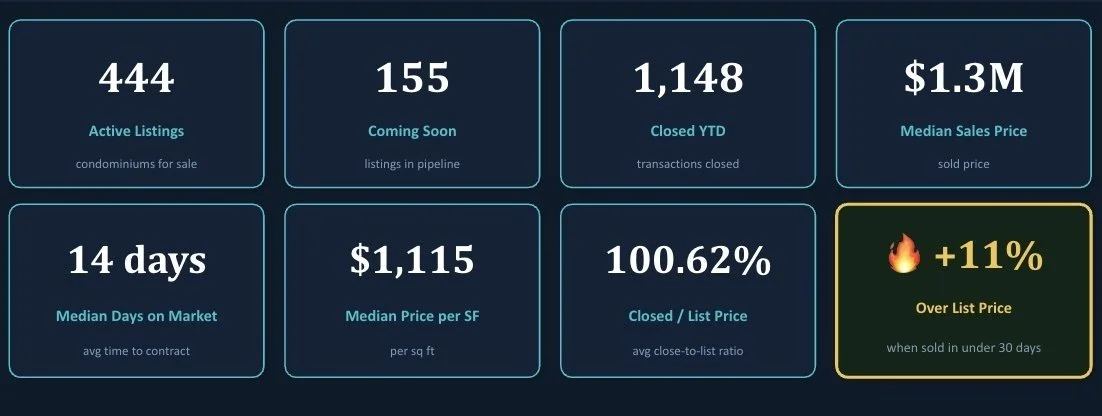
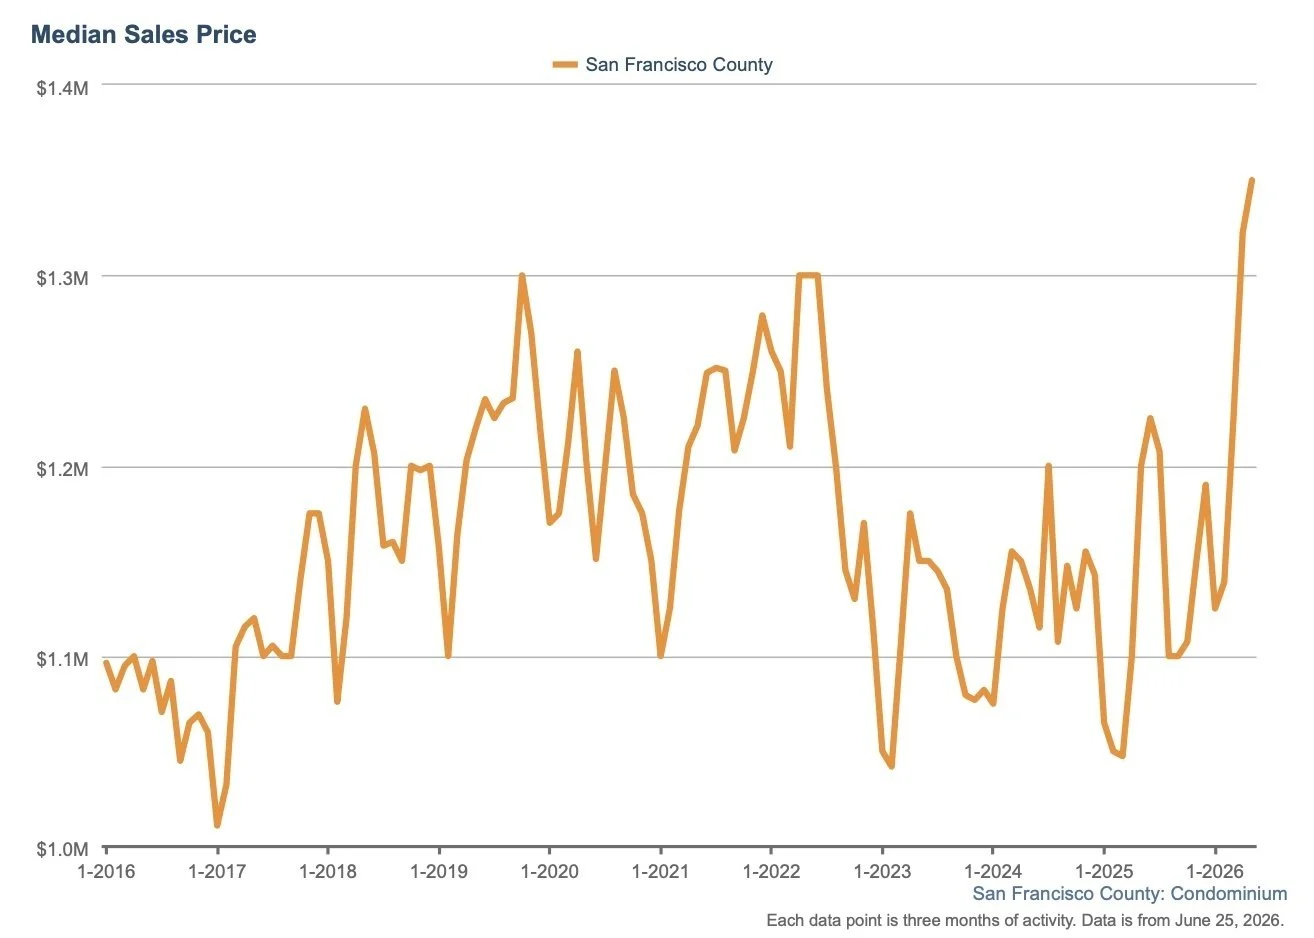
San Francisco Condo Prices Gain Momentum
San Francisco's condo market continues to build momentum. The median sales price has climbed to $1.3 million, matching the highest levels ever recorded, while well-priced condos are selling in a median of just 14 days and closing at an average of 100.62% of list price. Condos that sell within 30 days are averaging an impressive 11% over asking, a clear sign that buyers are competing for desirable properties.
The chart below illustrates the remarkable rebound in condo values. After several years of uneven performance, prices have surged back to record highs, reflecting renewed buyer confidence, improving demand, and a market that continues to strengthen despite broader national uncertainty. (InfoSparks)
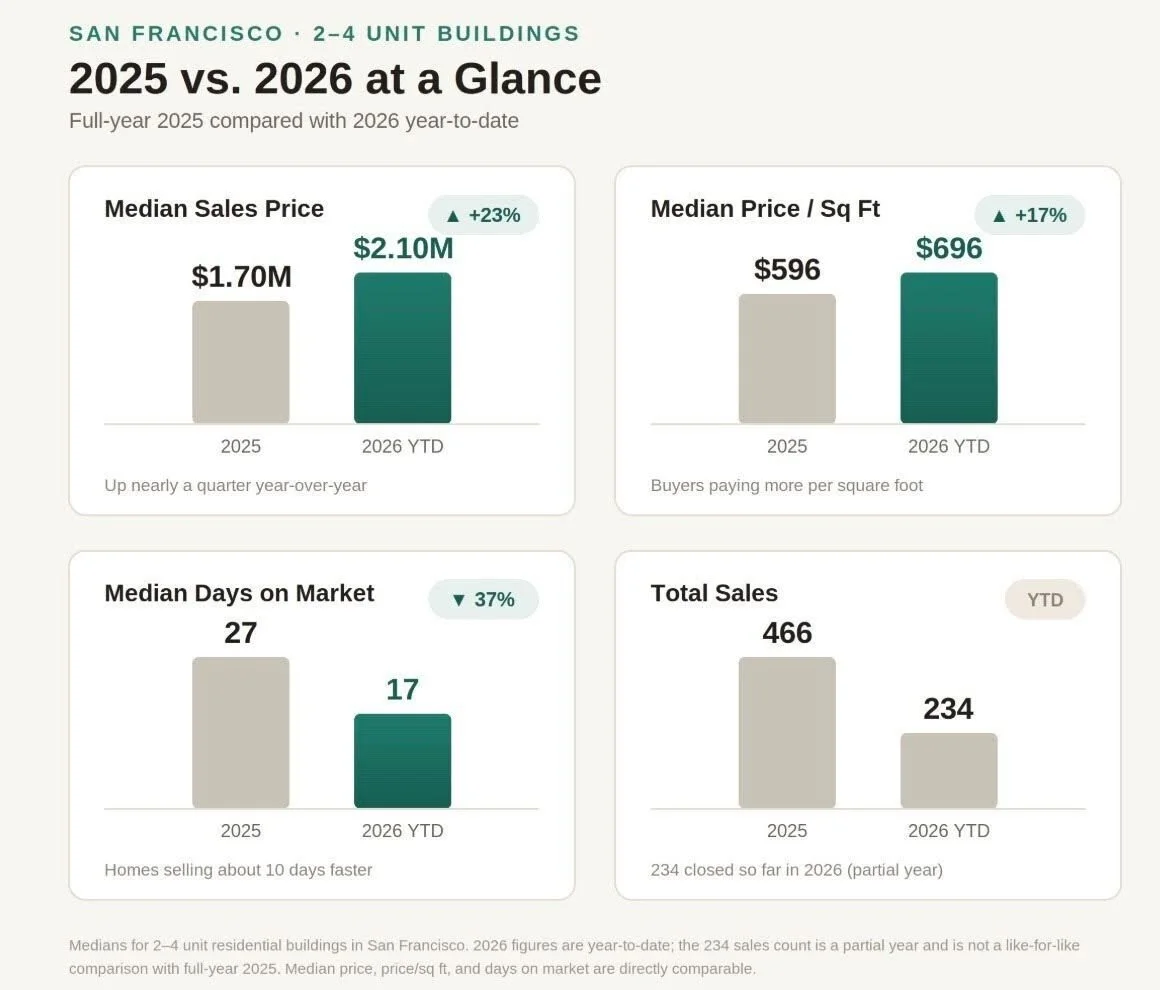
San Francisco Multifamily Market Picks Up Speed
The market for San Francisco's two-to-four-unit properties has strengthened considerably in 2026. While sales volume remains on pace with last year, well-priced buildings are selling faster and commanding higher prices. Median days on market have dropped from 27 to 17, the median price per square foot has climbed from $596 to $696, and the median sales price has increased from $1.70 million to $2.10 million. The data points to renewed demand for multifamily investments and owner-occupied opportunities across the city. (SFAR)
Record Pace for $2,000+/SF Sales
One statistic tells the story: in all of 2025, San Francisco recorded 19 single-family home sales at $2,000 or more per square foot. Year-to-date in 2026, that number has surged to 77, underscoring the strength of the city's luxury housing market. (SFAR)

The Last Word:
Rent vs. Buy, A Case Study
As more renters consider making the leap to homeownership, our agents are working closely with lenders to prepare personalized rent-versus-buy analyses that help clients evaluate both the immediate and long-term financial implications.
Scenario: Renting for $8,000 per month versus purchasing a $1.7 million single-family home in the Sunset with 20% down and a 6% 30-year fixed mortgage.
On monthly cash flow alone, renting wins. The estimated cost of ownership is approximately $11,400 per month, including principal and interest, property taxes, homeowners insurance, and a maintenance allowance.
But monthly cost is only part of the equation. Unlike rent, a portion of every mortgage payment builds equity. In this example, about $1,400 per month goes toward principal in the first year alone. Buyers may also benefit from tax advantages, depending on their individual circumstances, while participating in any future appreciation. At a modest 3% annual appreciation, a $1.7 million home would gain roughly $51,000 in value over one year.
For buyers planning to stay five years or longer, ownership often becomes increasingly compelling as equity builds and appreciation has time to offset transaction costs. For those with a shorter time horizon, renting may offer greater flexibility.
The takeaway? There is no universal answer. The right decision depends on your finances, lifestyle, and long-term plans. A personalized rent-versus-buy analysis can provide valuable clarity before making one of life's biggest financial decisions.
