The Price Isn’t Always the Price
“But the list price is $1,095,000!” exclaimed our buyer one recent summer morning. With the offer date looming, “Henry” was understandably focused on that number. The problem? The list price had very little to do with what the home was actually worth.
In San Francisco, list price is often less a statement of value than a marketing strategy. In this case, the property was priced to capture attention, draw a broad pool of buyers and, ideally, create competition. More than 30 interested parties had already requested the disclosure package, but the stronger clue was in the comparable sales: the most recent and relevant transactions pointed to a value well beyond Henry’s $1.5 million maximum budget. My prediction? This $1.095 million listing will ultimately sell north of $1.7 million. At the time of publication, offers had not yet been submitted, so stay tuned.
It’s an extreme example, but it illustrates one of the most confusing realities of San Francisco real estate: the asking price, market value, and eventual sales price can be three very different numbers.
And this year, the gap between those numbers has become extraordinary.
As of August 18, 1,347 single-family homes have sold in San Francisco in 2026, and 89% of them, or 1,197 homes, sold over asking, with those homes selling for an average of 23% above their list price. The price-per-square-foot numbers tell a similarly compelling story: across all 1,347 sales, the median list price was $923.46 per square foot, while the median closed price reached $1,161.45 per square foot.
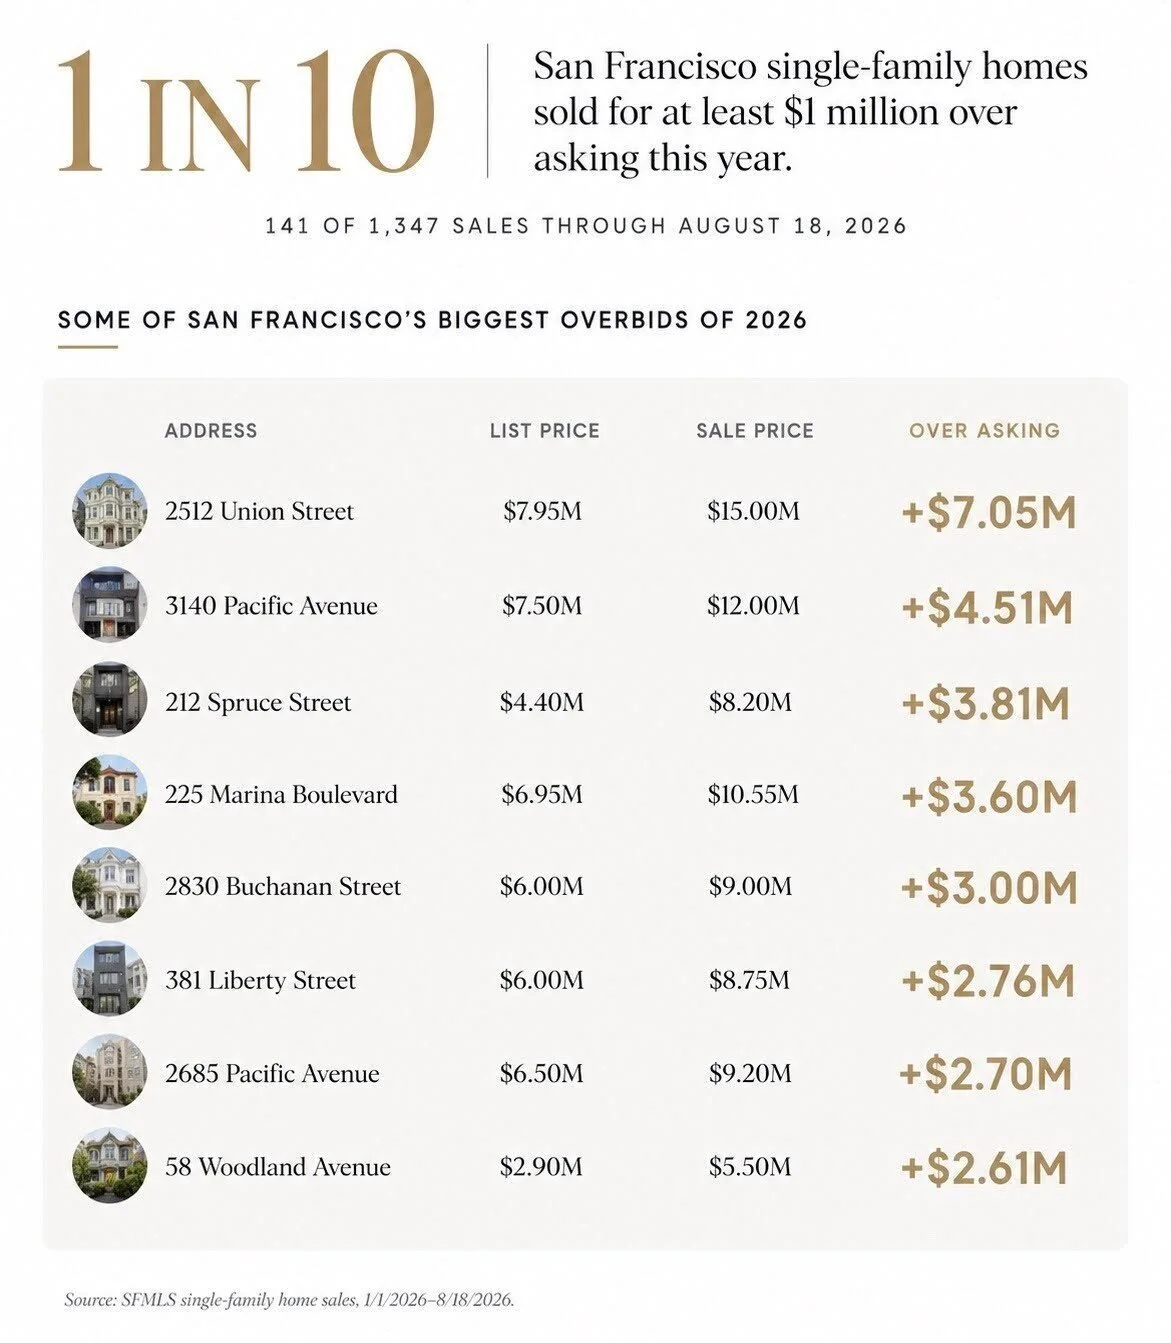
But perhaps the most remarkable number is this: 141 San Francisco single-family homes have sold for at least $1 million over their list price this year. That's more than 10% of all single-family home sales, or roughly one out of every 10 homes sold.
For perspective, we went back and looked at every single-family home sale in San Francisco in 2025. There were 2,182 sales for the entire year, and just 20 homes sold for $1 million or more over list price, representing less than 1% of all sales, or about one in every 109 homes.
2025: 1 in 109.
2026: 1 in 10.
And 2026 isn't over yet.
Some of the individual sales are eye-popping. A home at 2512 Union Street, for example, was listed at $7.95 million and sold for $15 million, an astonishing $7.05 million over asking. At 58 Woodland Avenue, a home listed just under $2.9 million ultimately sold for $5.5 million, nearly 90% above its list price. These aren't simply stories about buyers wildly overpaying. In many cases, they are examples of deliberate pricing strategies designed to attract a large buyer pool, create urgency and let competition determine the final price.
That's an important distinction, because a dramatic overbid makes a great headline, but “sold 30% over asking” doesn't necessarily mean a buyer paid 30% more than the home was worth. It may mean the property was intentionally listed well below the price that recent comparable sales suggested it would command.
For sellers, this is where pricing becomes both art and science. A home worth approximately $2.2 million could conceivably be listed at $1.895 million, $2.095 million, $2.195 million or even $2.295 million. Each price sends a different message to the market and can produce very different buyer behavior. The highest list price doesn't necessarily produce the highest sales price. In the right circumstances, pricing lower can create the competition necessary to sell higher.
But that strategy isn't right for every property. A highly desirable single-family home with a deep buyer pool may respond beautifully to aggressive pricing. A condo, luxury property, tenant-occupied home or property with a more limited audience may require an entirely different approach. There is no single “San Francisco pricing strategy.” The strategy has to fit the property, the neighborhood, the competition and the market at that particular moment.
For buyers, the lesson is equally important: don't confuse asking price with affordability. A beautiful home listed for $1.8 million may not really be competing in the $1.8 million market at all. Conversely, a home listed at $2.2 million that has been sitting on the market for several weeks may offer far more negotiating opportunity than its asking price initially suggests.
The takeaway isn't simply that San Francisco homes are selling well above asking. It's that list price and market value are often two very different things. In today's market, understanding the strategy behind the number may be every bit as important as the number itself.
All of which makes understanding pricing strategy particularly important as we head into San Francisco’s fall market. After an exceptionally supply-constrained spring and summer, we’re beginning to see the seasonal return of new inventory, giving buyers more choices, but not necessarily less competition. Well-located, well-presented homes are still attracting significant attention, and buyers should be prepared to move quickly when the right one appears, while also looking well beyond the list price to understand where it is actually likely to trade. Mortgage rates remain the wildcard, continuing to bounce around rather than make the sustained move downward many buyers have been waiting for. For those still on the sidelines, fall could present an interesting window: more homes to choose from now, while any meaningful drop in rates could bring even more buyers into an already competitive market.
And in a market this nuanced, choosing the right agent matters enormously, particularly for buyers. Buyers need someone who knows the most recent sales intimately, understands not just what a comparable property sold for but why it sold for that price, and has the experience to distinguish an intentionally low list price from a genuine opportunity. Reputation matters, too. In a competitive bidding situation, you want an agent on the other side whom listing agents know, trust and want to work with. Just as importantly, a great buyer’s agent knows when to encourage you to stretch and when to help you step away, bringing some practical perspective to a decision that can understandably become very emotional. Sellers should be looking for many of those same qualities: deep market knowledge, strong relationships, sound judgment and an agent who understands that pricing a home isn’t simply about choosing a number. It’s about choosing a strategy.
We’ll dive into this more, below, but first here’s an overview of what’s happening nationwide.
The National Data
Mortgage Rates Reverse Course
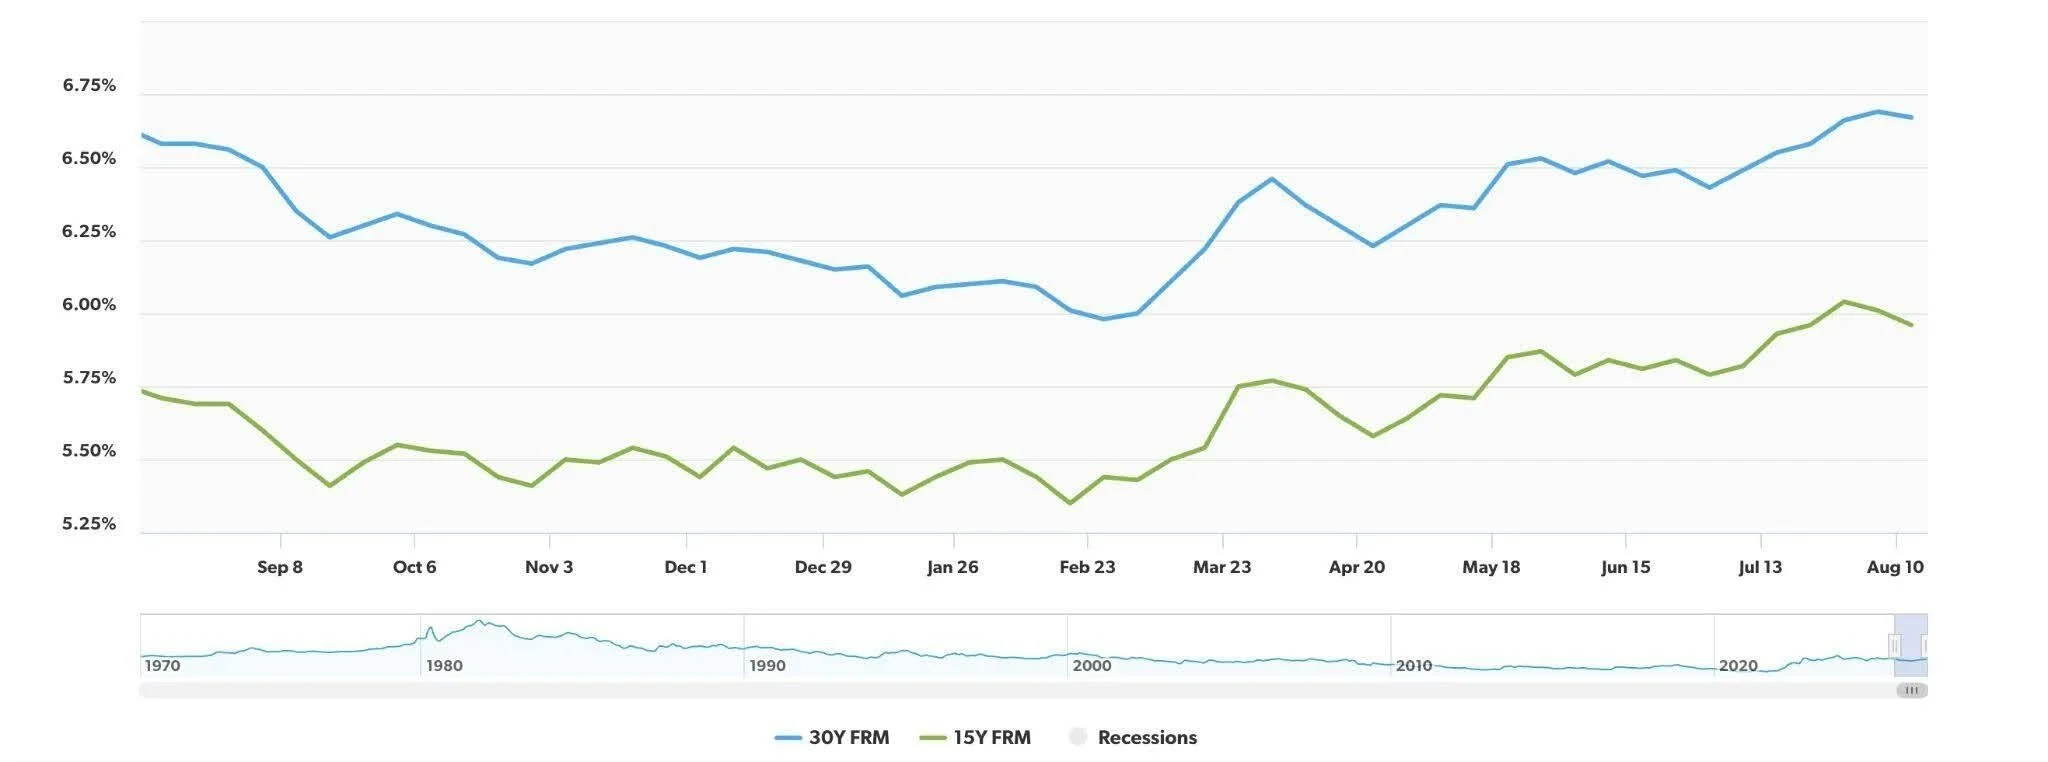
After drifting lower through much of the fall and winter, mortgage rates bottomed out around late February before reversing course this spring. Freddie Mac’s latest survey puts the average 30-year fixed mortgage at 6.67% (blue line) and the 15-year fixed at 5.96% (green) as of August 13. Both remain elevated, and the 30-year rate is now slightly higher than it was a year ago (6.58 and 5.71%), reinforcing why buyers waiting for a dramatic rate drop have yet to see much relief. (Freddie Mac)
Inflation Is Sending Mixed Signals
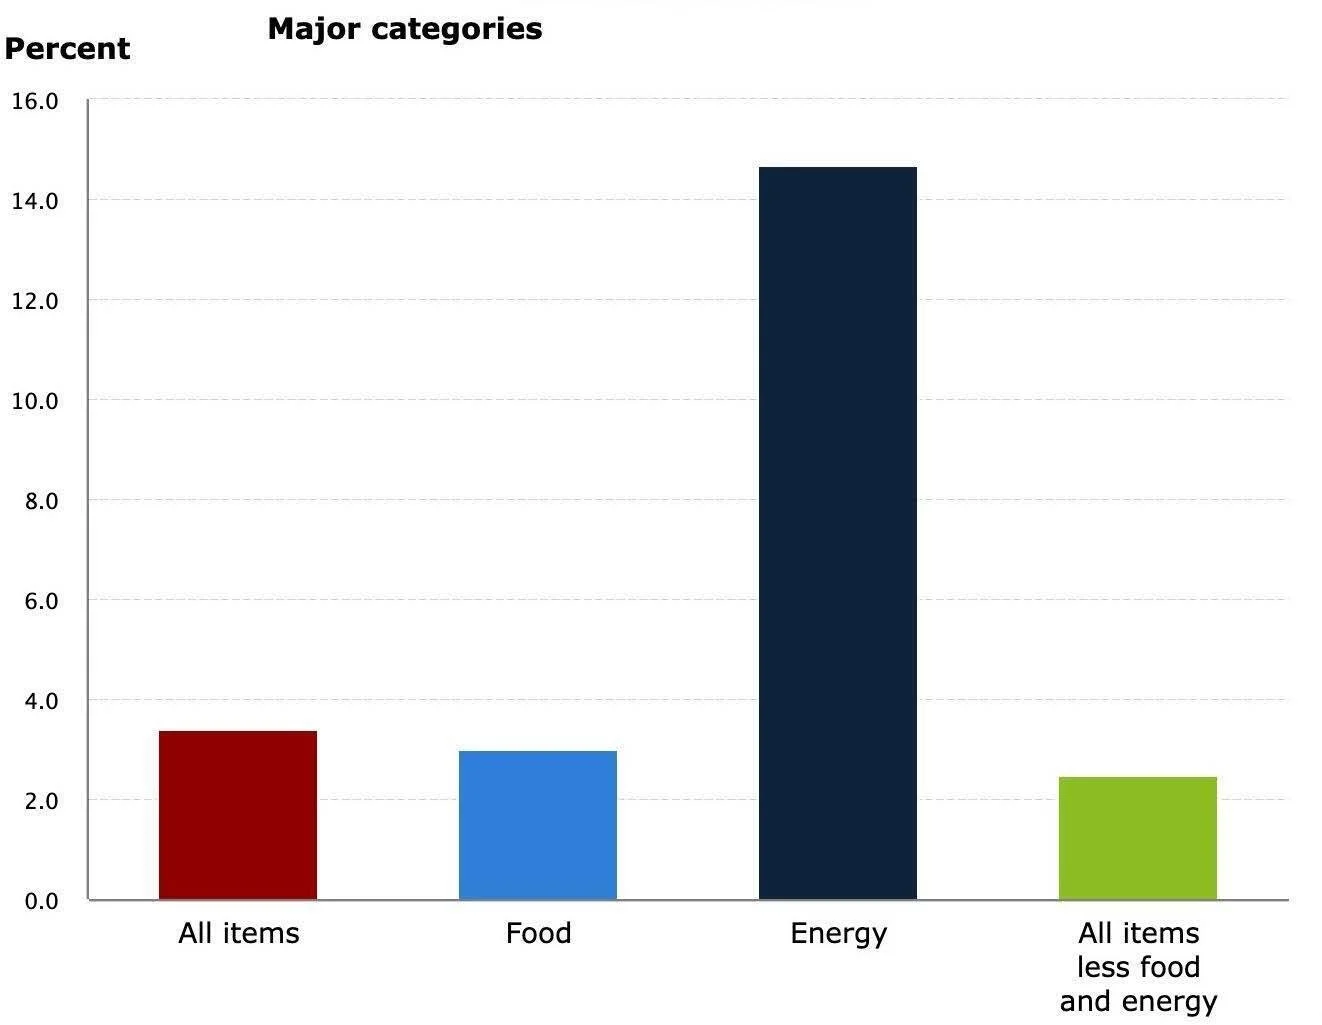
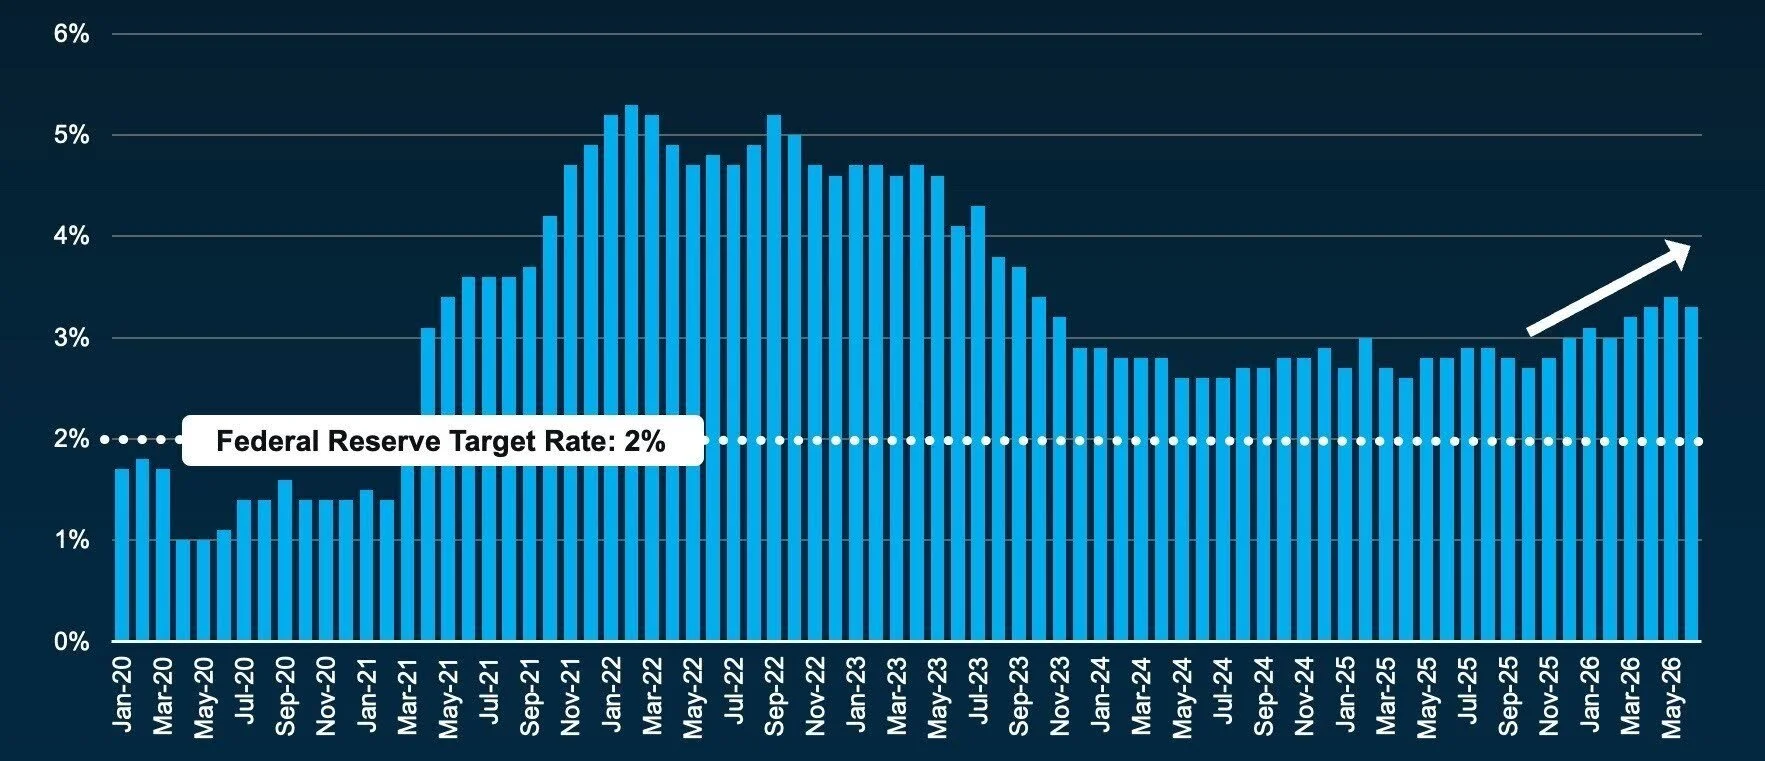
The latest CPI report (the first chart, below) offered some encouraging news, with prices rising just 0.1% in July and core inflation easing to 2.5% year over year. But another key measure, the Personal Consumption Expenditures (PCE) Price Index, the Federal Reserve’s preferred gauge of inflation, has recently been moving in the opposite direction and remains well above the Fed’s 2% target (the second chart, below). That matters for real estate because stubborn inflation makes it harder for interest rates, and ultimately mortgage rates, to come down meaningfully, suggesting buyers waiting for dramatically lower borrowing costs may have to remain patient. (BLS, Investing.com)
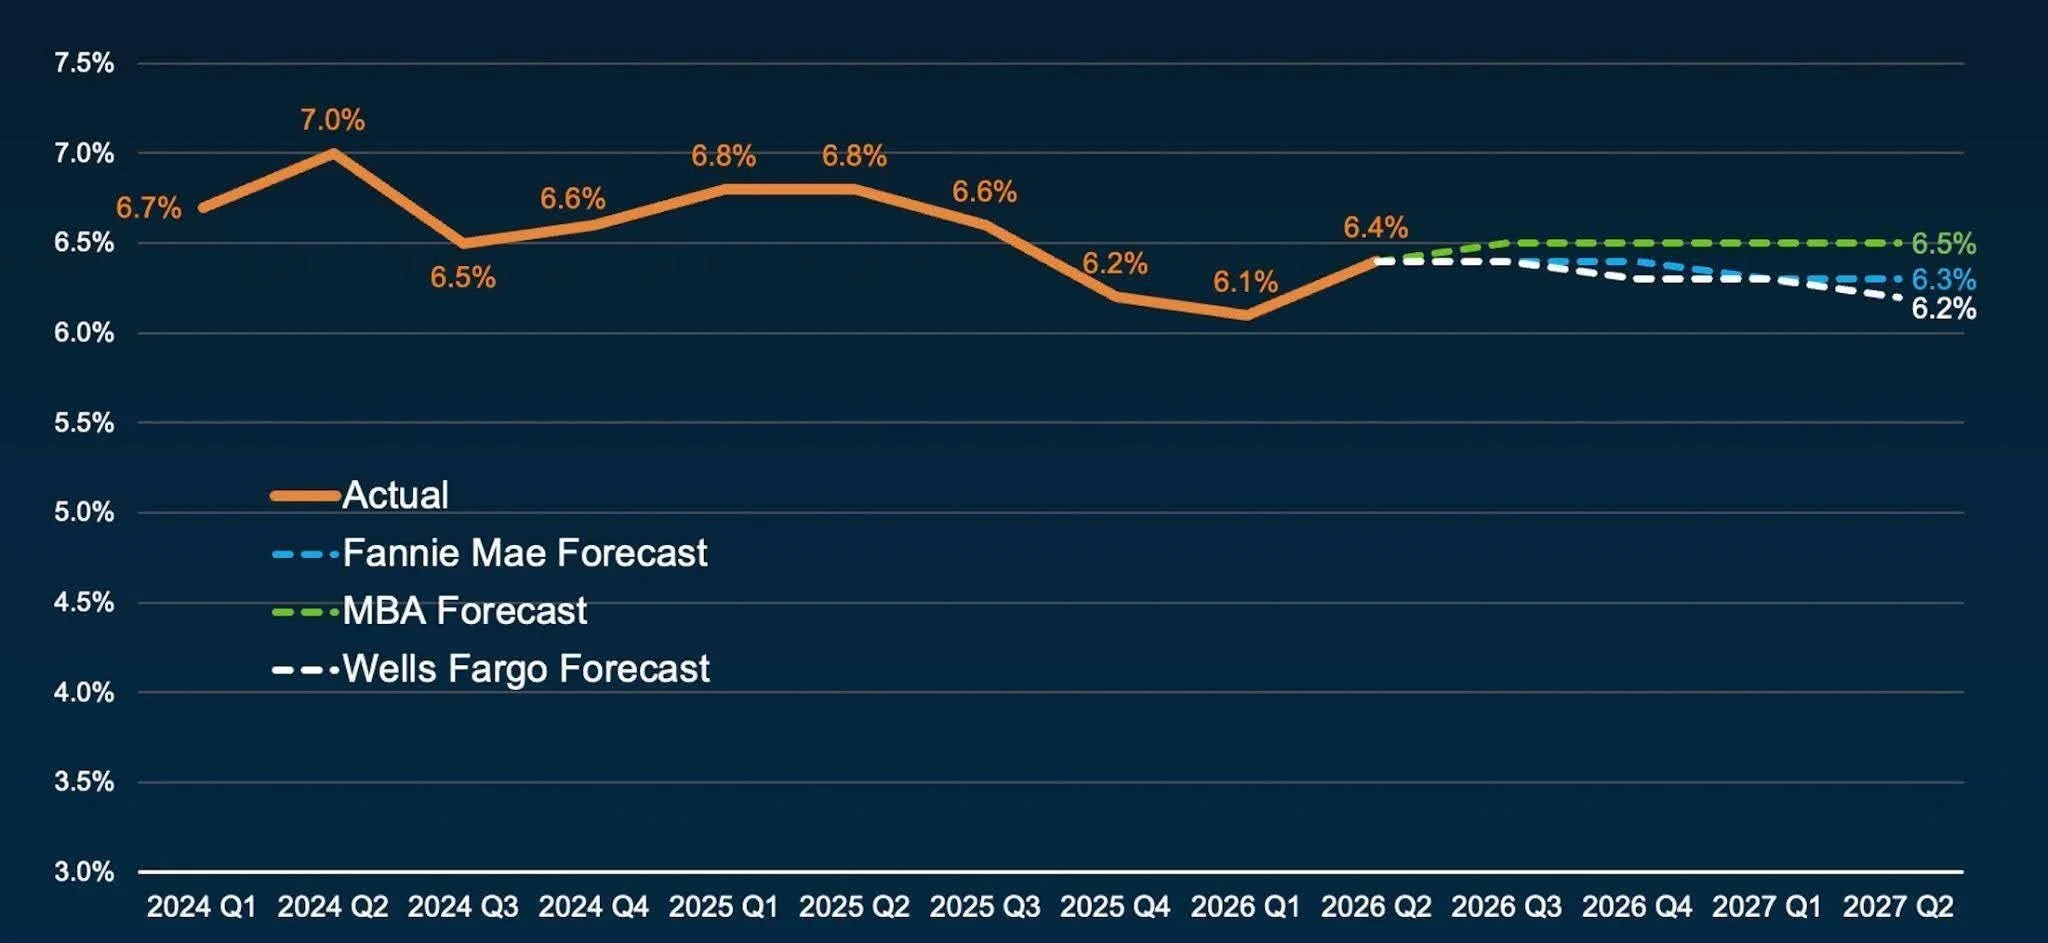
Mortgage Rates Expected to Stay in the 6% Range
For buyers waiting for a dramatic drop in mortgage rates, forecasters aren't expecting one anytime soon. Fannie Mae, the Mortgage Bankers Association and Wells Fargo all project the 30-year fixed rate to remain in the low-to-mid 6% range through the first half of 2027. For real estate, relative stability may actually be good news: buyers and sellers can make decisions with greater confidence rather than trying to time the market around a significant rate drop that may not materialize. (Freddie Mac, Fannie Mae, MBA, Wells Fargo)
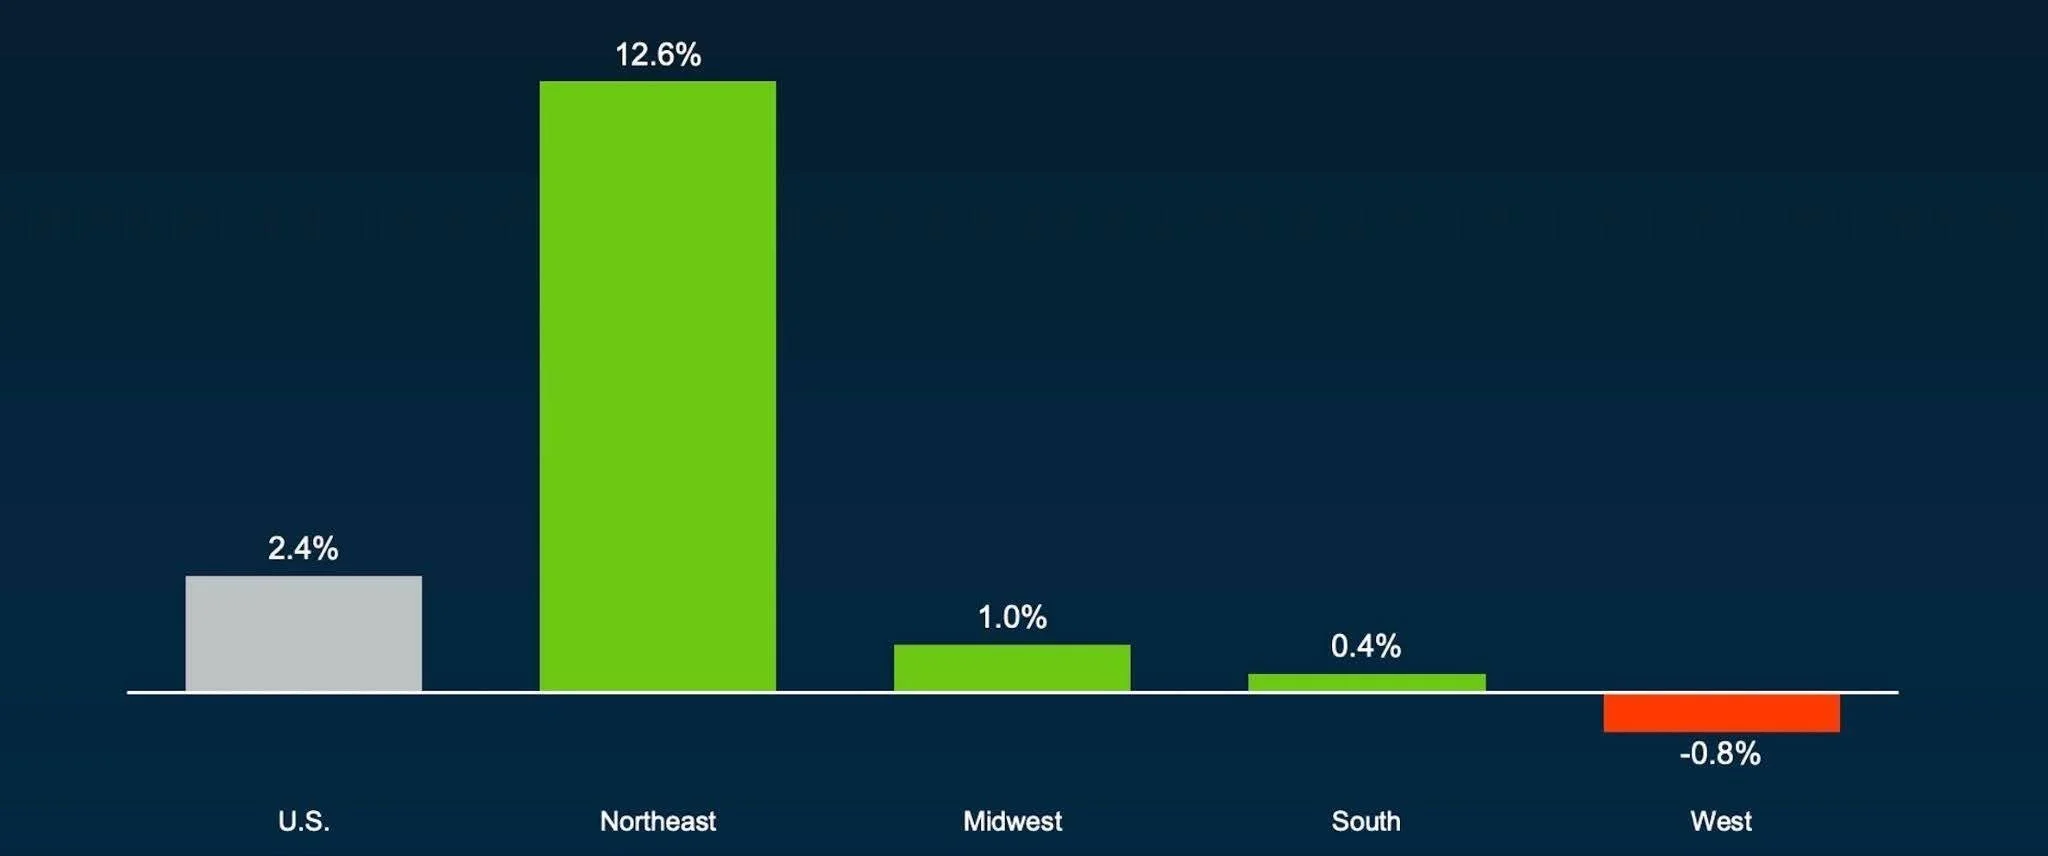
New Listings Rise Nationally, Led by the Northeast
Fresh inventory is beginning to grow, but the picture varies dramatically by region. New listings rose 2.4% nationally year over year, led by a striking 12.6% increase in the Northeast, while the Midwest and South posted much smaller gains of 1.0% and 0.4%, respectively. The West was the exception, with new listings down 0.8%, underscoring how different our part of the country remains from the national trend. (Realtor.com)
Local Data
Where Are Buyers Bidding the Most?
Of course, not every San Francisco neighborhood plays by the same pricing rules. When we looked at the sale-to-list price ratio for all 1,347 single-family homes sold through August 18, the differences across the city were striking. At the district level, Sunset/Parkside led the city with a median sale-to-list ratio of 134.6%, followed by what real estate agents call District 9, which includes Bernal Heights and the Mission, at 128.0%; the Richmond at 125.7%; Central San Francisco, including Noe Valley, Eureka Valley and Duboce Triangle, at 124.4%; and West of Twin Peaks, including West Portal, St. Francis Wood, Miraloma Park and surrounding neighborhoods, at 124.0%.
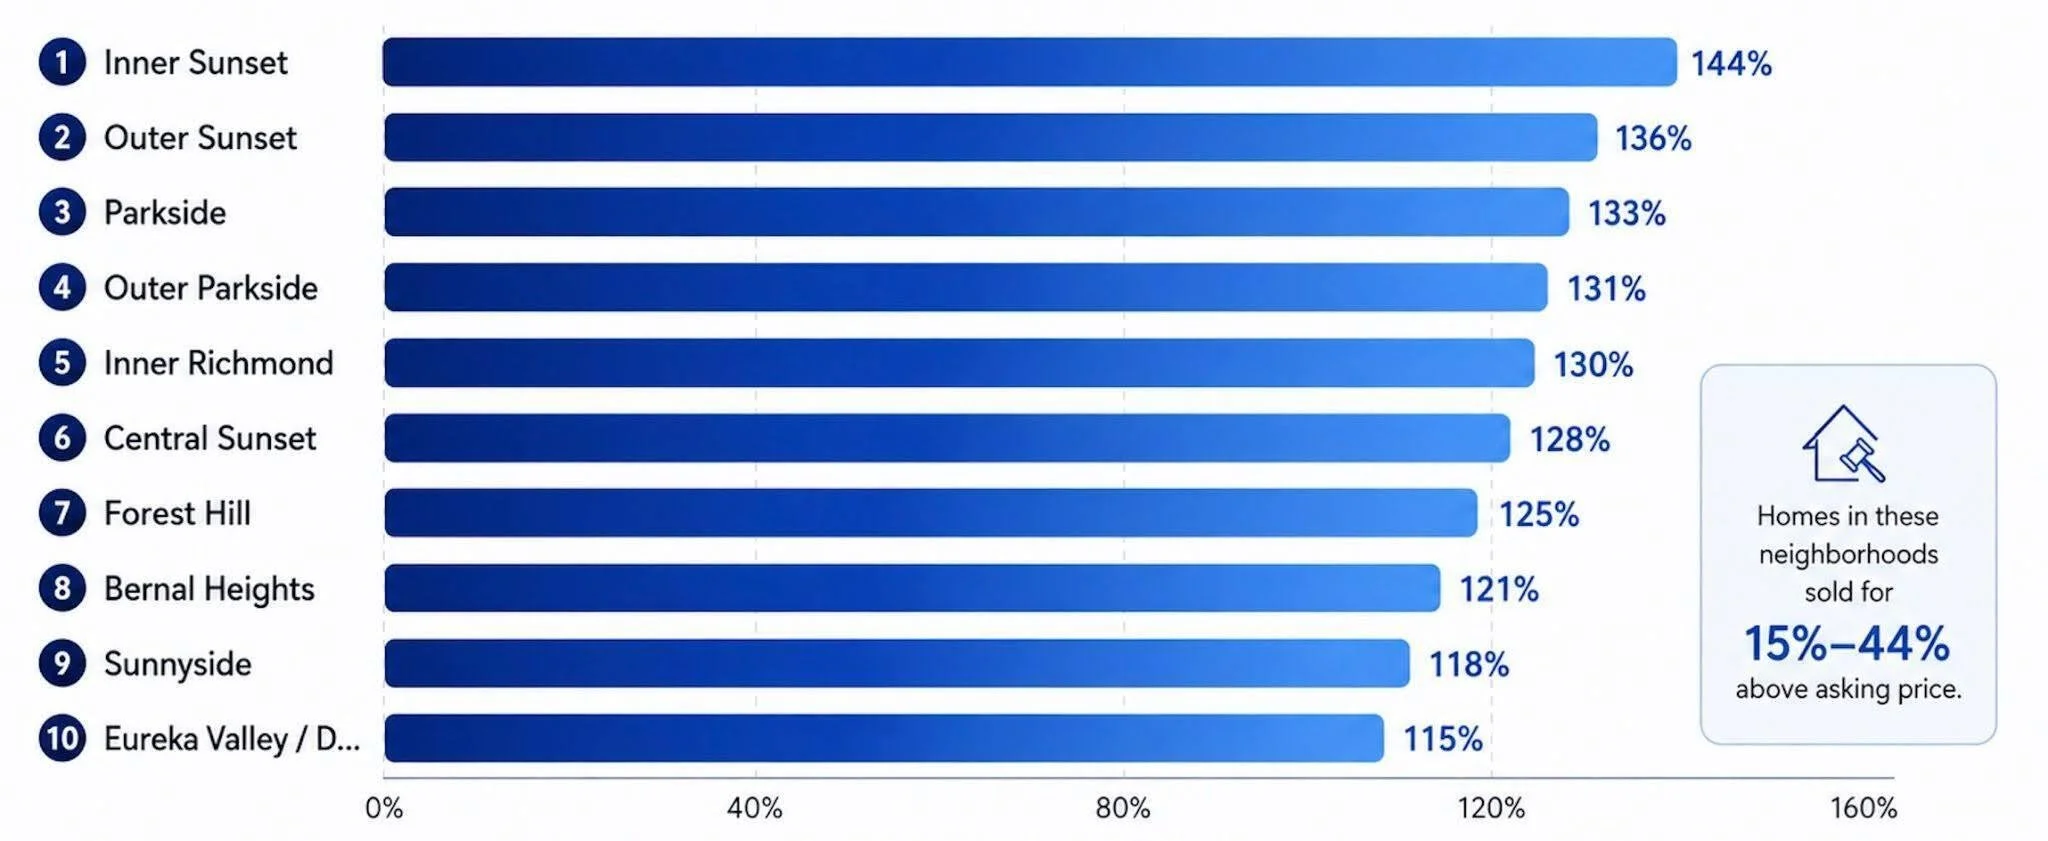
Drill down to individual neighborhoods and the numbers become even more dramatic. Among neighborhoods with at least 10 sales, the Inner Sunset topped the city with a median sale-to-list ratio of 144.1%, meaning the typical house sold for roughly 44% above its asking price. The Outer Sunset followed at 137.6%, Parkside at 136.2%, Outer Parkside at 134.4%, and the Inner Richmond at 134.0%. In fact, five of the six highest-ranking neighborhoods were in the Sunset/Parkside district.
Perhaps most interesting is where the highest sale-to-list ratios are occurring. They aren't concentrated in San Francisco's most expensive neighborhoods, such as Pacific Heights, Presidio Heights or the Marina. Instead, the biggest percentage overbids are showing up in neighborhoods like the Sunset, Parkside and Inner Richmond, where single-family homes attract a deep pool of buyers and sellers frequently use aggressive pricing strategies to generate competition.
That doesn't necessarily mean these neighborhoods are more competitive than the city's luxury markets. Rather, it demonstrates how differently homes are priced across San Francisco, and why percentage over asking can tell us as much about pricing strategy as it does about buyer demand.
For buyers, this is another reminder that a list price has to be interpreted within its micro-market. A $1.5 million asking price in the Inner Sunset may mean something very different from the same asking price elsewhere in San Francisco. Knowing the most recent comparable sales is essential, but understanding how a particular neighborhood prices and trades is every bit as critical.
San Francisco’s Bidding Wars Are Hottest on the West Side
San Francisco buyers are bidding most aggressively for single-family homes in the city’s western neighborhoods. Inner Sunset leads the pack, with the typical home selling for roughly 44% above asking, followed closely by Outer Sunset, Parkside and Outer Parkside. The takeaway: overbidding remains a defining feature of San Francisco’s 2026 housing market, particularly in neighborhoods once considered more value-oriented. (SFMLS, Single-family home sales through August 18, 2026; median sale-to-list ratio, neighborhoods with at least 10 sales.)
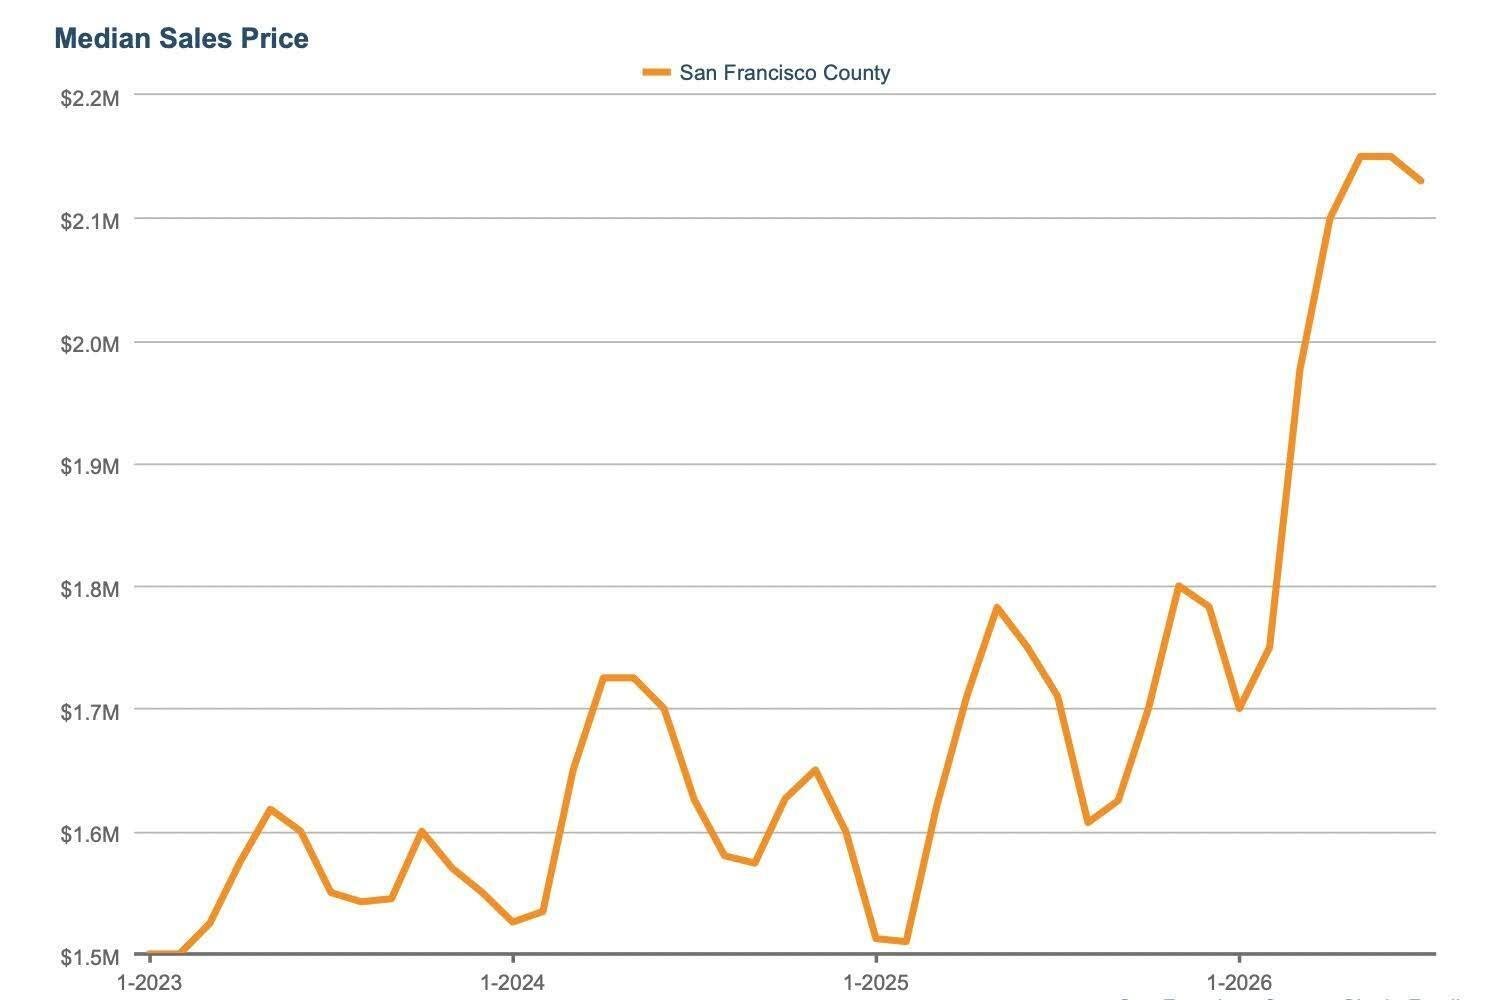
San Francisco Home Prices Hover Near Record Highs
San Francisco’s median single-family home price reached $2.13 million in July, just shy of May’s 2026 high of $2.15 million and nearly 25% above July 2025’s $1.71 million. While prices naturally fluctuate month to month, the larger story is clear: San Francisco home values have moved sharply higher over the past year and remain near historic highs. (InfoSparks)
San Francisco Condo Prices Remain Firm
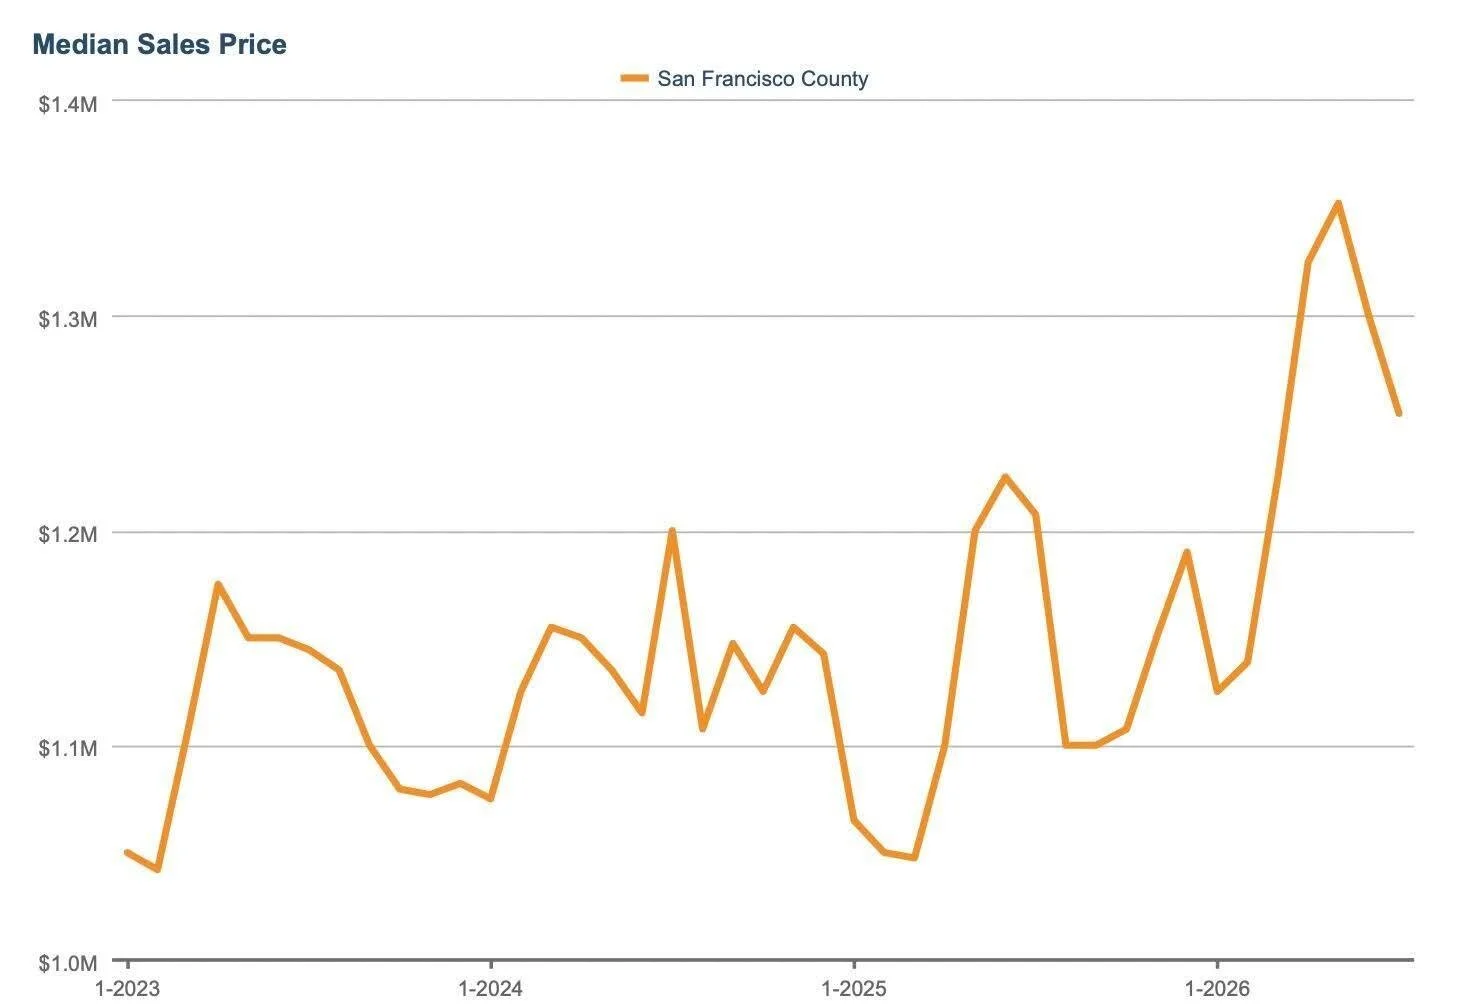
San Francisco’s median condo sales price was $1,254,500 in July, down from the May 2026 high of $1,352,500, but still 3.9% higher than July 2025’s $1,207,500. While the condo market hasn’t seen the dramatic price gains of single-family homes, values remain above year-ago levels, pointing to a market that has strengthened considerably from its recent lows. (InfoSparks)
SF Home Values Surge to Record Highs
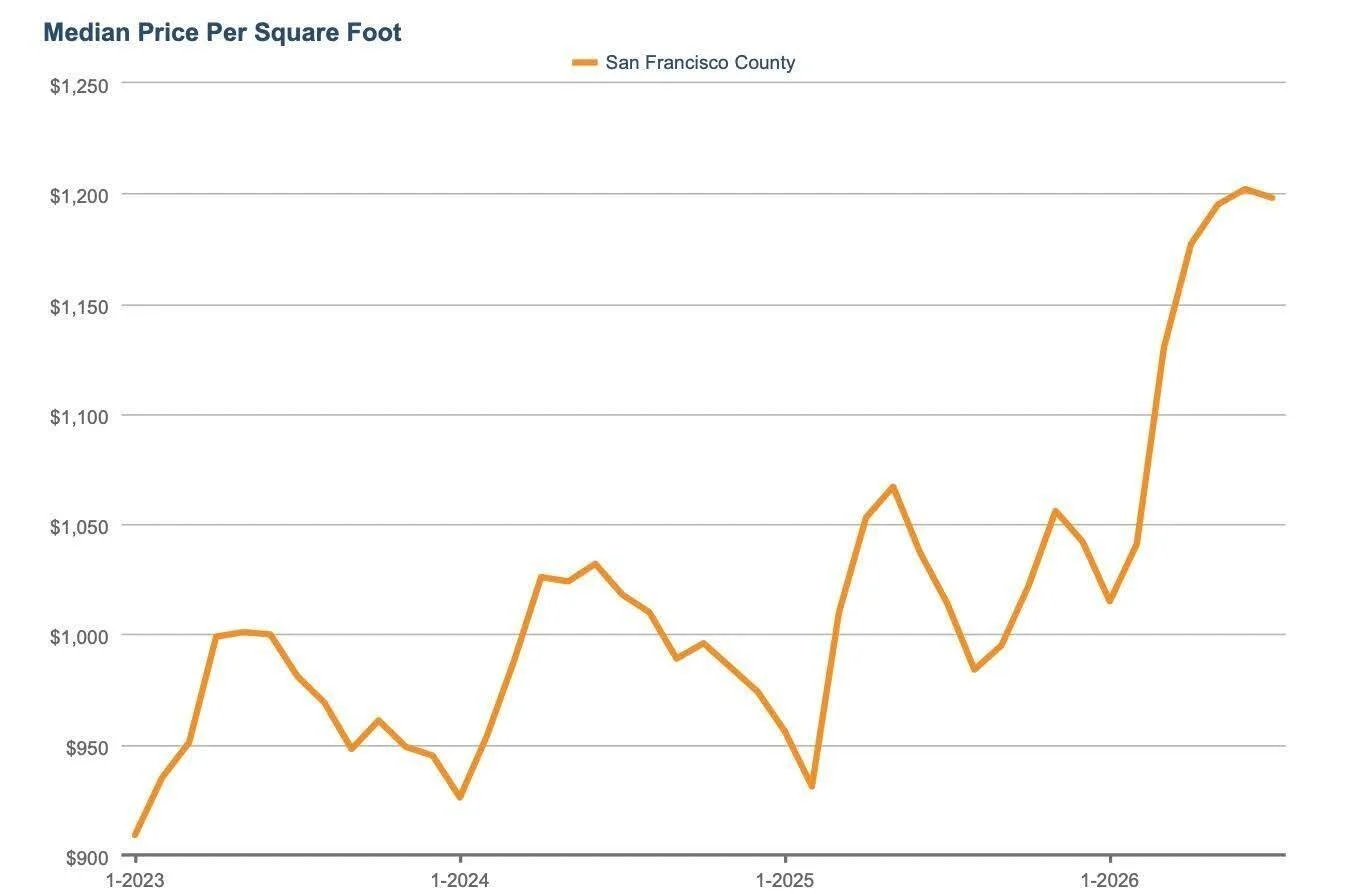
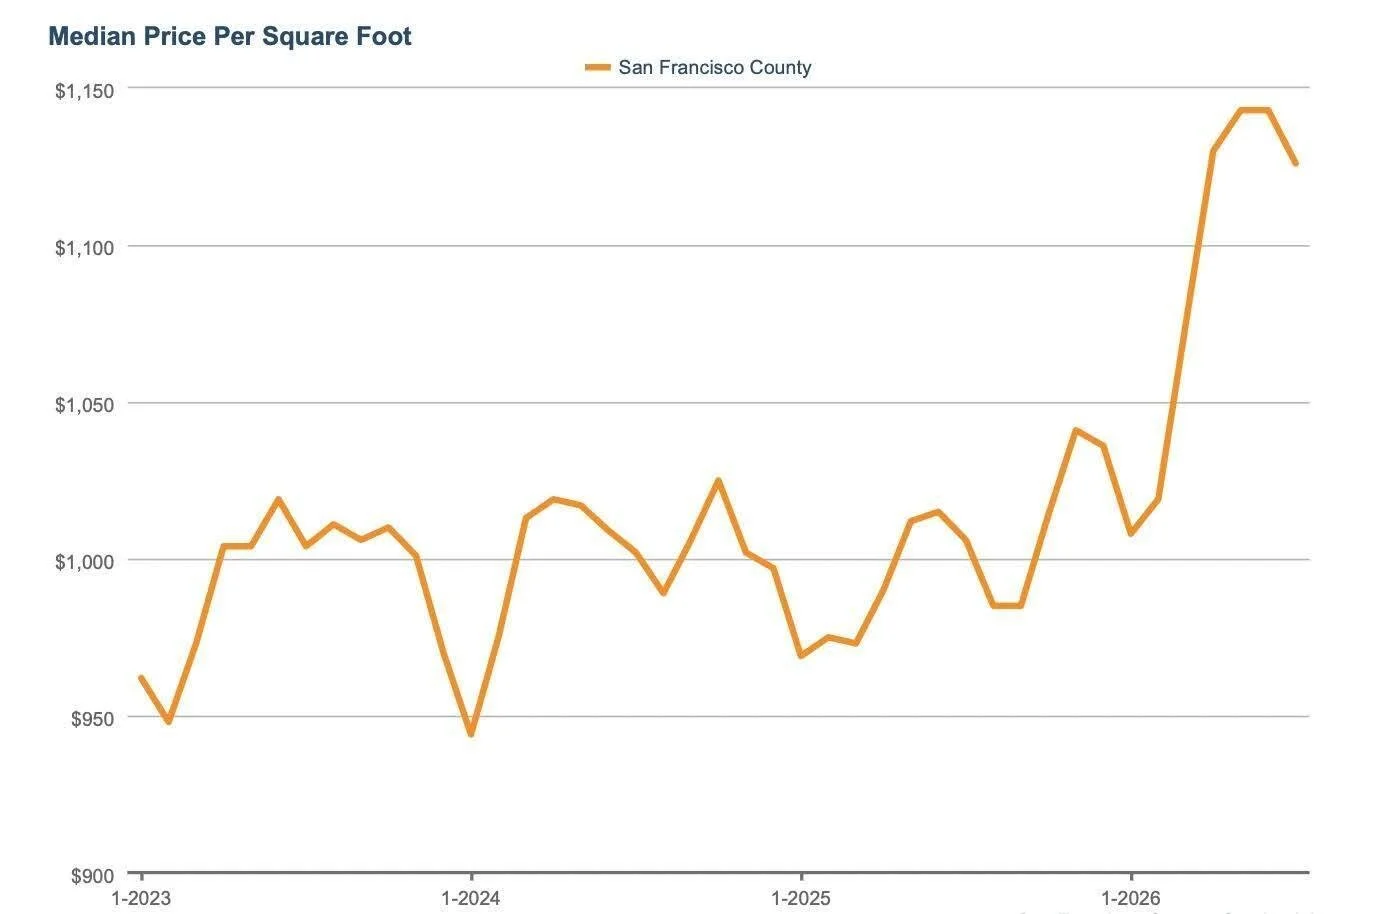
The median price per square foot for San Francisco single-family homes reached $1,198 in July, just shy of June’s all-time record of $1,202. That record surpassed the previous peak of $1,175 set in April 2022. Even more striking, July’s median was 18% higher than a year ago, when homes sold for a median $1,014 per square foot. (InfoSparks)
SF Single-Family Home Supply Remains Exceptionally Tight
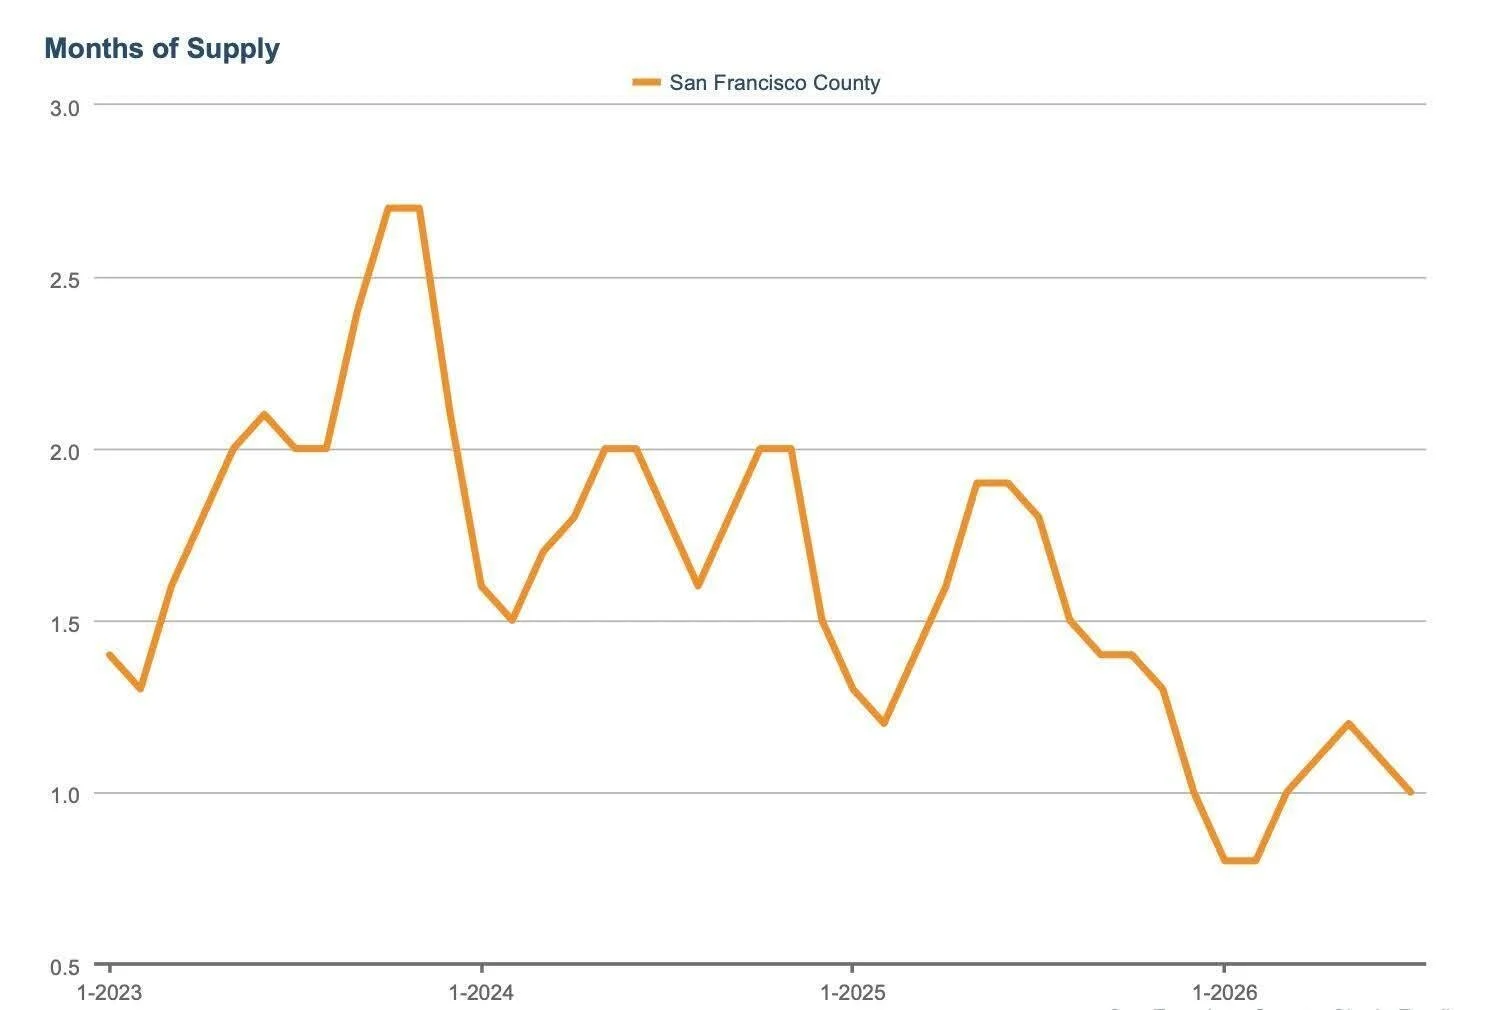
San Francisco single-family homes registered just 1.0 month of supply in July, up modestly from February’s low of 0.8 months, but well below the 1.8 months recorded in July 2025. The last time supply was this constrained was February 2022, when MSI also reached 1.0. What does MSI mean? Months Supply of Inventory estimates how long it would take to sell the available inventory at the current pace of sales if no new homes came to market. The lower the number, the tighter the market. At just 1.0 month, San Francisco remains firmly in seller’s-market territory, with limited supply helping fuel competition and upward pressure on prices. (InfoSparks)
SF Condo Inventory Tightens, But the Story Varies by Neighborhood
San Francisco’s condo market registered just 2.1 months of supply in July, close to the 1.9-month lows reached in January and February and dramatically below July 2025’s 3.9 months. For perspective, the previous low was 2.2 months in February 2022, underscoring how significantly the overall condo market has tightened. But this is a citywide number, and not every neighborhood is experiencing the same market. In SFAR District 9, which includes areas such as the Mission, SoMa and South Beach, condo inventory is closer to 3 months of supply, giving buyers considerably more choice. As always in San Francisco, the market can look very different depending on the neighborhood and property type. (InfoSparks)
The List Price Alone Doesn’t Tell You What a Home Is Worth
If you need one statistic to understand just how competitive San Francisco’s single-family home market has become, we will reiterate what we mentioned at the beginning of this newsletter: 141 homes have sold for at least $1 million over asking so far in 2026. That’s roughly 1 in every 10 homes sold, compared with about 1 in 109 last year. Across the city, buyers are routinely paying hundreds of thousands, and sometimes millions, above the advertised price.
But there’s an important lesson behind all those eye-popping overbids: in San Francisco, asking price is often a pricing strategy, not necessarily a reflection of value.
That distinction has arguably never mattered more. Buyers need to understand what a home is actually likely to sell for before deciding whether to compete, and sellers need a pricing strategy designed for their specific property, neighborhood, and buyer pool.